Trading Strategies · Lesson 40/57 · 9 min read
Supply and Demand Zones: Finding Fresh Zones and How They Differ from Order Blocks
In this article
- What Supply and Demand Zones Actually Are
- Why the Zone Reacts: Unfilled Orders and Imbalance
- The Four Base Patterns: RBR, DBD, DBR, RBD
- What Makes a Zone Strong: Proximal/Distal Lines, Freshness, and Speed
- Entry, Stop, and Target: A Worked Example
- Supply and Demand Zones vs. Order Blocks
- Limitations and Caveats
- FAQ
- Summary
What Supply and Demand Zones Actually Are
Lesson 4's Support, Resistance, and Breakout Trading drew a single horizontal line at a price level that had reacted multiple times in the past. Supply and demand zones apply the same underlying idea — a level the market is likely to react to again — but define it as a zone, not a line. This framework predates the ICT/smart-money school by decades; it's a classic price-action method popularized by traders like Sam Seiden long before "order block" entered the vocabulary.
The core definition: when price consolidates tightly for a handful of candles, that sideways stretch is called a base. If price then leaves the base sharply and impulsively in one direction, the base itself becomes a demand zone (if the breakout was up) or a supply zone (if it was down). The trading premise is that when price later swings back into that same zone, it's likely to react the same way again — bouncing off a demand zone, or getting rejected at a supply zone.
Why the Zone Reacts: Unfilled Orders and Imbalance
The usual explanation for why price consolidates tightly inside a base is that buying and selling pressure were roughly balanced at that level. When one side suddenly overwhelms the other and price rips away, two things are thought to be left behind in that zone:
- Unfilled orders: because price moved away so quickly, some participants who wanted to buy (or sell) more at that level never got fully filled.
- Late participants: traders who missed the original move may treat a return to that same level as a second chance to get in at a similar price.
As with the stop-loss cascades covered in Lesson 6's Risk-Reward and Money Management, none of this is something you can verify from public order-book data — it's an interpretive framework, not an audited fact. The reason it has persisted for decades anyway is that, empirically, many markets do show a statistically noticeable tendency to react at these levels more often than at random price points. That's a far cry from "always works" — treat it as a level with a somewhat better-than-average odds of reacting, not a guarantee.
The Four Base Patterns: RBR, DBD, DBR, RBD
A zone's character depends on the direction price moved both before and after the base. The first letter is the move into the base; the last is the move out of it.
| Pattern | Before → After | Zone Type | Character |
|---|---|---|---|
| RBR (Rally-Base-Rally) | Up → Up | Demand zone | Continuation — a pullback inside an uptrend |
| DBD (Drop-Base-Drop) | Down → Down | Supply zone | Continuation — a bounce inside a downtrend |
| DBR (Drop-Base-Rally) | Down → Up | Demand zone | Reversal — marks a trend flip at the bottom |
| RBD (Rally-Base-Drop) | Up → Down | Supply zone | Reversal — marks a trend flip at the top |
Continuation zones (RBR, DBD) generally get more confidence because they align with a trend that's already in motion. Reversal zones (DBR, RBD) can catch the very start of a new trend, but they carry more risk when the reversal doesn't materialize and the prior trend simply resumes.
What Makes a Zone Strong: Proximal/Distal Lines, Freshness, and Speed
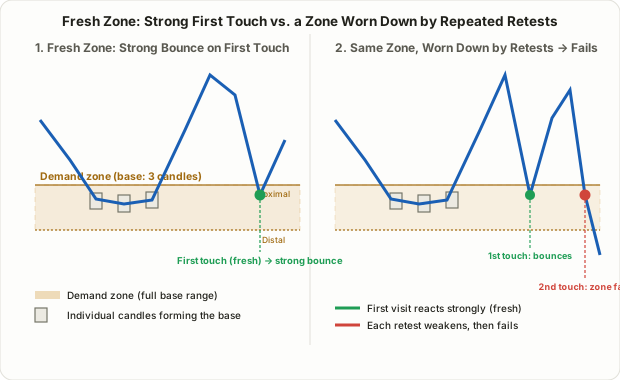
Every zone gets two boundaries. The edge closer to current price — where the breakout actually started — is the proximal line; the far edge, the opposite extreme of the base, is the distal line. Common practice is to look for entries near the proximal line and place stops just beyond the distal line.
Not every zone carries equal weight. Traders typically lean on a handful of rule-of-thumb criteria, none of which are hard rules:
- Is it fresh? A zone price hasn't revisited since it formed is called a fresh zone; one that's already produced one or more reactions is a tested zone. Each visit is thought to consume more of the unfilled orders sitting there, so the first visit (and often the second) is treated as meaningfully more reliable than the third or later.
- Speed of departure: how sharply price left the base. A near-vertical breakout is read as a stronger imbalance than a slow, grinding move away.
- Zone width: a tight, compact base (candle bodies overlapping closely) is generally treated as a stronger zone than a wide, loose one — and a tighter zone also means a tighter, more efficient stop-loss.
- Number of candles in the base: a short base of one to three candles is often weighted more heavily than a sprawling base of six or seven. Note the distinction from Lesson 12's Volume Profile and POC: volume profile defines levels by where the most volume traded, while supply and demand zones are defined purely by candle shape and departure speed, with no volume data required at all.
Entry, Stop, and Target: A Worked Example
Here's how the rules play out with numbers. Say a stock consolidates tightly between $49.50 and $50.50 across three candles (the base), then rips higher to $55.00.
- Defining the zone: that base ($49.50–$50.50) becomes the demand zone. The proximal line sits at $50.50, closer to where the breakout began; the distal line sits at $49.50, the opposite extreme.
- Entry: if price retraces back down to roughly $50.50, that's when a long entry comes into consideration — more conservative traders wait for a reversal candle or a lower-timeframe confirmation signal inside the zone rather than buying the instant price touches it.
- Stop-loss: placed just below the distal line, say around $49.30. The logic: if the zone is genuinely holding, price shouldn't need to trade back through that extreme.
- Target: usually the next pool of liquidity — a prior swing high, or the next supply zone above. If the prior high in this example sat at $54.00, the trade risks $1.20 (entry $50.50 minus stop $49.30) to make $3.50 (target $54.00 minus entry $50.50) — roughly a 2.9R setup.
These numbers are purely illustrative; real risk-reward varies enormously by instrument and market condition. Always pair this with an independent filter like Lesson 13's ATR Stops, Net-Edge Filters, and CMF Confirmation.
Supply and Demand Zones vs. Order Blocks
Lesson 39's ICT order blocks get confused with supply and demand zones constantly, but they come from different traditions and operate at different levels of precision.
| Supply & Demand Zone | Order Block | |
|---|---|---|
| Origin | Classic price-action analysis, popularized by traders like Sam Seiden | ICT / smart-money concepts school |
| Scope | The whole base — usually 3-7 candles, a wide "area" | The single last opposing candle before an impulse, a narrow "point" |
| Key criteria | Base tightness, departure speed, number of retests | Whether a break of structure (BOS) followed |
| Strength | Good for marking a wide zone of interest on a higher timeframe | Tighter stop-loss, better raw risk-reward when it's right |
| In practice | Often used first, to establish where to even look | Often used second, inside a zone, to sharpen the exact entry |
There's no real reason to treat these as competing systems. A common workflow is to use a supply or demand zone to establish the broad area where a reaction is likely, then use an order block or a lower-timeframe reversal signal inside that same zone to tighten the actual entry. Think of the zone as the map and the order block as the pin dropped on it.
Limitations and Caveats
- Subjectivity: there's no universal rule for exactly where a base starts or ends, or how many candles count as "the base," so two traders can draw meaningfully different boundaries on the same chart.
- Timeframe dependence: a level that looks like a clean zone on one timeframe can disappear entirely on another. Decide which timeframe you're basing the zone on and apply that consistently.
- Crowding risk: because the concept is so widely taught, an obvious zone can attract a cluster of small retail orders, which can make it an attractive spot for larger participants to sweep rather than respect.
- Unverified premise: the claim that unfilled orders are actually sitting in a given zone can't be confirmed from public data. Backtest it against your own market and timeframe before trusting it with real capital.
FAQ
How is this different from the support and resistance in Lesson 4?
Lesson 4's support and resistance looks backward at a level price has already reacted to multiple times. A supply or demand zone is defined by how it formed — a base followed by an impulsive move — rather than by reaction history, and it's drawn as a range rather than a single line. The two often overlap on the same chart.
How many times can a fresh zone be touched before it's "used up"?
There's no fixed rule, but the first visit (the truly fresh touch) is generally treated as the most reliable, with the second visit still worth some weight. By the third visit, enough of the resting unfilled orders are assumed to have been consumed that many traders either heavily discount the zone or skip it entirely.
Is it safe to trade zones on their own, without anything else?
Not recommended. A zone flags an area where a reaction is more likely — it isn't a complete trading signal by itself. Pair it with a lower-timeframe confirmation, an independent stop-loss rule, and awareness of the broader trend before acting on it.
Summary
- Supply and demand zones treat a base — a tight consolidation followed by a sharp impulsive move — as a support/resistance area, an approach that predates ICT concepts.
- The four base patterns are RBR and DBD (continuation) and DBR and RBD (reversal), based on the direction of the move before and after the base.
- Zone strength comes down to freshness, departure speed, zone width, and the number of candles in the base — and reliability drops with every retest.
- Common practice is to enter near the proximal line, stop just beyond the distal line, and target the next pool of liquidity.
- The key difference from order blocks is scope: a wide area versus a single precise candle — and in practice, many traders use a zone to find the neighborhood and an order block to pick the exact entry.
- This is an unverified, fairly subjective framework, so always combine it with independent risk management and confirmation signals.