Trading Strategies · Lesson 84/87 · 8 min read
Level 2 Order Book Imbalance Trading: Reading Bid/Ask Depth for Entries
In this article
What the Candle Chart Never Shows You
A candlestick only reports the outcome of a fight that already ended. Open, high, low, close — all four numbers summarize trades that have already filled. None of them tell you how much size buyers and sellers currently have resting on the book, waiting to trade. That live information lives on a different screen entirely: Level 2, also called the DOM (Depth of Market) or, in Korean trading platforms, the "호가창." It lists resting sell orders stacked above the current price and resting buy orders stacked below it, each row showing the size waiting at that exact price — the depth.
One thing has to be said plainly before going any further: displayed depth is a display, not a promise. A resting order can be cancelled at any moment before it fills, so a huge stack of bids can vanish the instant price actually gets there. This lesson covers the method traders actually use to extract a short-term directional read from that imperfectly reliable information: order book imbalance. It's easy to confuse with "stack imbalance" from Lesson 16's Order Flow Trading: Footprint Charts and CVD — but that measures imbalance in volume that has already traded, while this lesson's imbalance measures resting size that hasn't traded yet. Similar name, genuinely different data.
The Imbalance Ratio: Turning Depth Into One Number
The standard formula for order book imbalance is:
Imbalance ratio = (Total bid size − Total ask size) ÷ (Total bid size + Total ask size)
The result always falls between −1 and +1. A reading near +1 means bids dominate with almost no resting asks; near −1 means the reverse; near 0 means the two sides are roughly balanced.
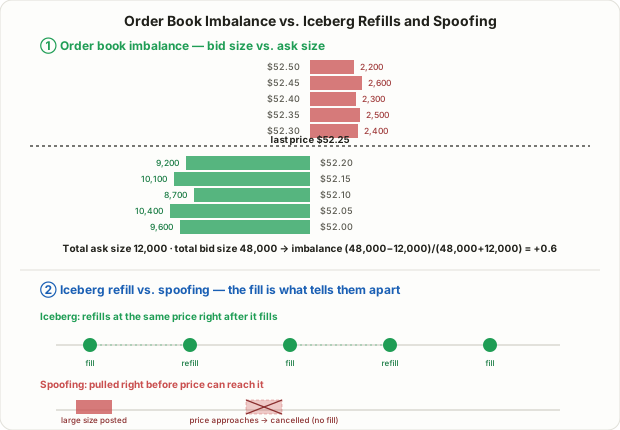
Here's a worked example. Suppose the top five price levels on each side of a stock's book show the following resting size:
| Level 1 | Level 2 | Level 3 | Level 4 | Level 5 | Total | |
|---|---|---|---|---|---|---|
| Ask size | 2,200 | 2,600 | 2,300 | 2,500 | 2,400 | 12,000 |
| Bid size | 9,200 | 10,100 | 8,700 | 10,400 | 9,600 | 48,000 |
Imbalance ratio = (48,000 − 12,000) ÷ (48,000 + 12,000) = 36,000 ÷ 60,000 = +0.6
Bids outweigh asks roughly four to one. Traders commonly treat a reading beyond roughly ±0.5-0.6 as a "clear imbalance" and anything inside ±0.2 as "balanced" — but that's an informal convention that varies by platform, not a statistically validated cutoff. Some order-flow tools flag an imbalance at a much lower threshold (one open-source execution library defaults to as little as 0.2), while others set the bar higher. One more thing matters a lot in practice: top-of-book alone (just Level 1) is extremely noisy — a single large order appearing or getting pulled can swing the ratio by itself. Summing several levels, typically somewhere between three and ten, is the common way to smooth that noise out.
Two Cases, Same Ratio, Opposite Outcomes
An imbalance reading by itself isn't enough — it only becomes meaningful once you watch how it evolves alongside price. Compare two scenarios.
Case A: A stock trading just below resistance shows an imbalance ratio climbing to +0.65. At the same time, the tape shows a steady stream of aggressive buy fills hitting the offer, and the ask size stacked above resistance is visibly shrinking level by level as those fills land. The buy-side imbalance holds while the resistance offers get eaten away, and price clears the level cleanly. This reads as resting demand converting into real fills and absorbing the supply in its way — a reasonably trustworthy breakout tell.
Case B: The imbalance ratio also climbs to +0.65, but this time most of the bid size sits a few levels back from the current price — levels 4 and 5, not 1 and 2. As price drifts slowly toward that size, the bids evaporate to less than half their size before a single fill prints against them. The ratio flips from +0.65 to −0.1 within seconds, and price turns down instead of up. The size sitting further back never showed real intent to trade — it disappeared the moment price got close, and the net effect was a push in the opposite direction.
Both cases showed the identical surface number (+0.65), yet the outcomes were opposite. What separates them is whether that resting size actually converts into fills, or evaporates as price approaches. That's why experienced traders never read the ratio in isolation — they also check whether the size sits close to the current price (levels 1-2) and whether it's shrinking because it's getting filled or because it's getting cancelled.
How Icebergs and Spoofing Actually Look on the Book
The "size that disappears" problem above is the same subject Lesson 78's Iceberg Orders vs. VWAP/TWAP Algos approached through the tape (Time & Sales); here it's viewed directly on the live book instead. Watching one price level closely over time typically reveals one of two patterns:
- Iceberg refill: size displayed at a price gets filled, disappears, and near-identical size reappears at that same price almost immediately. This is the normal, fully legal behavior of an iceberg order — only a slice of the total is ever shown, with the rest refilling automatically as each slice trades. The defining feature is that an actual fill occurred.
- Spoofing: a large resting order appears, swings the imbalance ratio hard in one direction, then quietly gets pulled the instant price gets close enough to actually trade against it. No fill ever occurs — that's the critical difference from an iceberg. Spoofing is illegal market manipulation in most major markets precisely because the order was never meant to trade; in the US it's a criminal offense under the 2010 Dodd-Frank Act, and enforcement has produced real, large penalties — JPMorgan paid $920 million in 2020 over spoofing-related charges tied to its trading desks.
The only reliable way to tell the two apart is to cross-check against the actual fill record: did that size trade, or did it just vanish? Watching the book alone leaves real ambiguity; adding Time & Sales data meaningfully raises confidence.
Limitations and Traps
Several structural limits are worth stating plainly before using this in a live account.
- Speed is not on your side. Institutions and high-frequency participants see and react to book updates far faster than any retail terminal can render them. By the time a reading shows up on a retail screen, the underlying size may already be gone.
- Displayed size is never a commitment. As covered above, it's cancellable at any moment before it fills. No ratio, however extreme, should be treated as a confirmed signal on its own.
- Hidden liquidity never shows up at all. The hidden portion of an iceberg order and volume routed through dark pools — covered in Lesson 25's Dark Pool Prints — never appear on the visible book. What you see is only part of total supply and demand.
- Data depth varies by venue. Some platforms expose five price levels, others ten or more, and plenty of free retail charting tools don't expose order book depth at all.
- No independently verified performance statistics exist. The thresholds and examples above reflect conventions commonly cited in trading education, not a validated, published backtest. Nothing here guarantees a specific win rate or return.
FAQ
Can retail traders actually see Level 2 data?
It depends on the broker and the market. Most Korean brokerage platforms provide ten levels of depth for free on domestic stocks, but Level 2 or full DOM data for US stocks and futures is frequently a separate paid subscription.
Does a strong imbalance guarantee price moves that direction?
No. As Case B shows, a strong ratio can reverse instantly if the underlying size gets cancelled instead of filled. Treat imbalance as a supporting filter alongside existing support/resistance or trend analysis, never as a standalone trade trigger.
How many price levels should the ratio sum across?
There's no fixed answer. Just the top level alone is too noisy; summing too many levels drags in size far from the current price and dilutes the signal. Three to ten levels is a common practical compromise, adjusted to how thick and volatile the specific stock's book normally runs.
Summary
- Level 2 (the DOM) shows resting bid and ask size in real time, unlike a candle chart, which only reports trades that have already completed.
- Imbalance ratio = (bid size − ask size) ÷ (bid size + ask size), giving a value from −1 to +1. A reading beyond roughly ±0.5-0.6 is commonly treated as a clear imbalance, but that threshold is an industry convention, not a validated rule.
- The same imbalance ratio can lead to opposite outcomes depending on whether the underlying size converts into real fills or evaporates as price approaches it.
- Iceberg refills are a legal order type where fills genuinely occur and size reappears; spoofing is illegal precisely because no fill was ever intended — telling them apart requires cross-checking the actual tape (Time & Sales).
- Speed disadvantages, invisible hidden liquidity, inconsistent data depth across platforms, and the absence of verified backtests mean this works best as a supporting signal, not a standalone reason to trade.