Trading Strategies · Lesson 51/57 · 10 min read
COT Report Trading: Reading Commercial vs. Large Speculator Positioning to Spot Market Extremes
In this article
- This Time, It's Data the Government Publishes Every Week
- What the COT Report Actually Is
- Why Extreme Commercial Positioning Becomes a Signal
- The COT Index: Normalizing Net Positions to a 0-100 Scale
- A Worked Example: Calculating COT Index Values for Hypothetical Gold Futures
- How COT Differs From the Other Positioning-Tracking Techniques in This Course
- Limitations and Pitfalls
- FAQ
- Summary
This Time, It's Data the Government Publishes Every Week
Every "follow the smart money" technique covered so far in this course digs into a different corner of the market. Lesson 22 mines public options exchanges for unusual sweeps. Lesson 25 reconstructs off-exchange equity block trades. Lesson 37 reads SEC filings from corporate executives. Lesson 33 tracks asset disclosures from lawmakers. The Commitment of Traders (COT) report, the subject of this lesson, is a different animal entirely — it isn't a filing from any single company or person. It's an official weekly tally, published by the US Commodity Futures Trading Commission (CFTC), of how every category of participant is positioned across the entire futures market.
COT data lives in the futures market rather than equities — mainly commodities like gold, silver, and crude oil, plus currencies and stock index futures. It answers a specific question every week: how lopsided is the split between hedgers with real physical exposure and speculative funds making directional bets? That question has drawn renewed attention from gold traders in particular, given how often gold has printed fresh all-time highs over the past couple of years.
What the COT Report Actually Is
The CFTC releases the COT report every Friday at 3:30 PM Eastern, and the data reflects positions as of the prior Tuesday's close. In other words, by the time you can read it, it's already three days stale — a structural lag worth keeping in mind, and one we'll return to later.
The CFTC actually publishes two versions:
- Legacy Report: the older, simpler classification, splitting participants into just two camps — Commercial and Non-Commercial.
- Disaggregated Report: available for commodity futures, breaking positions into finer categories — Producer/Merchant, Swap Dealer, Managed Money (hedge funds and CTAs), and Other Reportables.
This lesson builds around the Legacy Report's three-way split — Commercials, Large Speculators, and Small Traders — while noting that for commodities like gold, traders often substitute the Managed Money category from the Disaggregated Report as a cleaner proxy for "large speculators."
| Group | Who they are | Why they're in the market | Information edge |
|---|---|---|---|
| Commercial | Producers, processors, and merchants of the physical commodity (mining companies, refiners, grain merchants) | Hedging price risk on real exposure | Deep, constant contact with real-world supply and demand |
| Large Speculators (Non-Commercial / Managed Money) | Hedge funds, CTAs (commodity trading advisors) | Directional bets for profit | Tends to lean trend-following and momentum-driven |
| Small Traders (Non-Reportable) | Individual and small accounts below CFTC reporting thresholds | Personal investing/speculation | Fragmented, smaller sample — carries less weight as a signal |
Why Extreme Commercial Positioning Becomes a Signal
The logic behind this indicator comes down to one fact: Commercials and Large Speculators sit in the market for opposite reasons. A gold mining company needs to sell the gold it eventually digs up, so it habitually sells futures short as a hedge. Because it handles real production costs and physical supply every day, it has genuine insight into whether the current price is rich or cheap relative to the cost of extraction. Large Speculators like hedge funds and CTAs, on the other hand, tend to run trend-following or momentum-based strategies — buying more as price rises and selling more as it falls.
That structural setup produces a pattern traders have observed repeatedly:
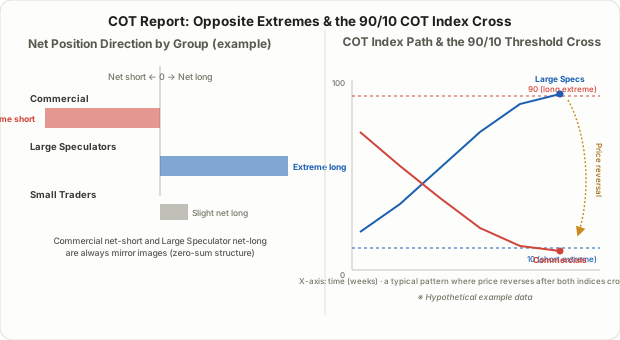
- When a rally runs long enough that Large Speculators' net-long position reaches a historical extreme, Commercials' net-short position tends to be sitting at a matching extreme on the other side — because rising prices make hedging at those higher levels more attractive to producers.
- At that point, Large Speculators are close to running out of fresh buyers — most of the crowd that was going to buy has already bought.
- Commercials, meanwhile, are signaling that they see this price level as an attractive hedge, which lines up with a fundamentals-based read that the market may be overextended.
Treating extreme Commercial positioning as a contrarian signal rests on that logic: the group with the deepest real-world information edge is leaning heavily the other way. This is a long-standing convention among traders who watch this data, not a guarantee that a trend reverses on any particular date.
The COT Index: Normalizing Net Positions to a 0-100 Scale
Raw net position numbers (contracts long minus contracts short) hide a trap. As a market grows in size over the years, absolute contract counts naturally grow with it, so a "record net long" headline can just be a byproduct of the market getting bigger — not a genuine positioning extreme. To fix this, traders widely use the COT Index, a normalization method popularized by legendary futures trader Larry Williams:
COT Index = (This week's net position − Minimum over the last N weeks) ÷ (Maximum over the last N weeks − Minimum over the last N weeks) × 100
N is commonly set to 26 weeks (about six months) or 156 weeks (about three years) — this isn't a fixed CFTC standard, just a convention traders have settled on, and the choice of N can meaningfully shift the resulting index value. Running the formula converts a raw net position into where it currently sits within its own recent range, on a scale from 0 (lowest in the lookback) to 100 (highest). Common interpretation thresholds look like this:
| COT Index reading | Interpretation |
|---|---|
| 90 or above | Extreme net-long relative to the lookback window |
| 10 or below | Extreme net-short relative to the lookback window |
| 10-90 | Neutral zone, no strong extreme signal |
A Worked Example: Calculating COT Index Values for Hypothetical Gold Futures
Let's put numbers to it. Say in a hypothetical gold futures market, Managed Money's (Large Speculators') net-long position ranged between 40,000 and 220,000 contracts over the trailing 26 weeks. This week's reading comes in at 210,000 contracts:
- (210,000 − 40,000) ÷ (220,000 − 40,000) × 100 = 170,000 ÷ 180,000 × 100 ≈ 94.4
Over the same window, Commercials (producers/merchants) ran a net-short position ranging from −250,000 to −90,000 contracts, with this week's reading at −240,000 contracts:
- (−240,000 − (−250,000)) ÷ (−90,000 − (−250,000)) × 100 = 10,000 ÷ 160,000 × 100 ≈ 6.25
Put side by side, the Large Speculator COT Index sits at 94.4 — well into extreme-long territory — while the Commercial COT Index sits at 6.25, deep in extreme-short territory, at the same time. That combination — both groups sitting at opposite extremes simultaneously — is generally treated as a more meaningful reading than either extreme showing up alone. That said, none of this is a green light to short right now. Extreme positioning only tells you that trend fuel may be running low, not when the reversal actually arrives. It's safer to treat an actual price confirmation — a break of support levels (Lesson 4) or a trendline break — as the real trigger, using the COT extreme as supporting context rather than the entry signal itself.
How COT Differs From the Other Positioning-Tracking Techniques in This Course
Lining up the "track the big players" techniques covered so far in one table makes the COT report's niche clearer.
| Technique | What it observes | Published by | Frequency | Applies to |
|---|---|---|---|---|
| COT report | Aggregate positions across the whole futures market | CFTC (government agency) | Weekly (as of Tuesday, released Friday) | Commodity, currency, and stock index futures |
| Dark pool prints | Individual large block trades | No single publisher (reconstructed from post-trade data) | Near real-time (with a reporting lag) | Individual stocks (equities) |
| Insider buying (Form 4) | Trades by a specific company's executives | SEC | Within 2 business days of the trade | Individual public companies |
| Congressional trading | Asset disclosures from a specific lawmaker | US Congress (STOCK Act) | Within 45 days of the trade | Individual stocks broadly |
What sets the COT report apart is that it shows market-wide positioning rather than a single stock's flow, and it groups data by motive-defined categories rather than by individual entity. If you need a micro-level read on one specific stock, dark pool prints or insider buying are the better-suited tools; COT is built for reading the crowd, not a single name.
Limitations and Pitfalls
- Structural reporting lag. By release time, the data is already three days old, and there have been stretches — including during US federal government shutdowns — where publication was delayed by weeks. This is never a real-time indicator.
- Extreme readings don't time the turn. A COT Index above 90 doesn't mean the trend reverses next week. In strong trends, the index can camp out in extreme territory for months at a stretch.
- Commercials aren't infallible. Their information edge is a statistical tendency, not a guarantee — individual hedgers can and do mistime their hedges.
- Category ambiguity. Especially in the Legacy Report, bank proprietary trading desks and swap dealers can end up classified as "Commercial," so it's a stretch to call this a clean read of pure physical hedging demand. The Disaggregated Report helps somewhat but doesn't fully solve this.
- Doesn't apply to individual stocks. COT is futures-market data, so it can't be used directly on a name like Apple or Tesla. It's useful for gauging broad market sentiment through instruments like S&P 500 index futures, not single-stock analysis.
- Results shift with the lookback window. Using a 26-week versus 156-week lookback for the COT Index calculation can produce meaningfully different readings for the exact same week, so it's worth checking more than one window.
FAQ
Where can I get the COT report for free?
The CFTC's own site (cftc.gov) publishes the full Commitment of Traders dataset for free every week under its Commitments of Traders section. The raw release is a dense numerical table, though, so most traders use free or paid charting services that convert the raw data into COT Index values or visual charts.
Can I use the COT report to analyze an individual stock like Apple?
Not directly. The COT report tracks futures-market positioning, so it only applies to markets where futures contracts actually trade — gold, silver, crude oil, major currencies, and stock indices among them. For tracking big-money flow in a single stock, insider cluster buying (Lesson 37) or dark pool prints (Lesson 25) are the more appropriate tools.
Does an extreme Large Speculator long position by itself mean I should sell?
Not on its own. In a strong uptrend, Large Speculators' net-long position can sit at an extreme for a long stretch while price keeps climbing. In practice, the signal carries more weight when Large Speculator extremes and Commercial extremes show up at the same time, and when actual price action — a trend break, a divergence — confirms it.
Summary
- The COT report is CFTC-published, weekly data on positioning across the entire futures market — grouped by Commercial, Large Speculator, and Small Trader categories rather than tied to any single company or person, which sets it apart from every other "smart money" technique in this course.
- Commercials hedge real physical exposure while Large Speculators chase directional bets, and that difference in motive tends to push the two groups toward structurally opposite positions.
- The Larry Williams-style COT Index normalizes raw net positions to a 0-100 scale relative to a trailing N-week window, with readings above 90 or below 10 commonly treated as extremes.
- A Large Speculator COT Index at an extreme long alongside a Commercial COT Index at an extreme short is generally treated as a more meaningful contrarian setup than either extreme alone — but it's a positioning clue, not a precise timing tool.
- Given the reporting lag, the tendency for extremes to persist for months, ambiguity in the Commercial classification, and its inapplicability to individual stocks, the COT report works best as supporting context on market-wide positioning rather than a standalone trade trigger.