Trading Strategies · Lesson 74/74 · 11 min read
Darvas Box Strategy: Stacking New-High Boxes Into a Pyramiding Trade
In this article
- What Is a Darvas Box: A Dancer's Breakout System
- Why the Box Works: A Range Where Supply Gets Absorbed
- Drawing the Box: The 3-Day Confirmation Rule
- Entry: Clearing the Ceiling on Volume
- Stops and Pyramiding: Stacking the Boxes
- A Worked Numeric Example (Simplified, Educational)
- Darvas Box vs. Turtle Trading (Donchian Channel): What's Different
- Limitations to Keep in Mind
- FAQ
- Summary
What Is a Darvas Box: A Dancer's Breakout System
The Darvas Box was built in the 1950s-60s by Nicolas Darvas, a professional dancer who traded stocks on tour with nothing but weekly closing prices wired to him by telegram — no real-time quotes at all. He later wrote up the method in How I Made $2,000,000 in the Stock Market, and it's worth saying upfront that the specific dollar figure in that title is his own personal account, not a verified or repeatable statistic. What did outlast the anecdote is the "box" framework itself, which became one of the standard templates for breakout trading in the decades since.
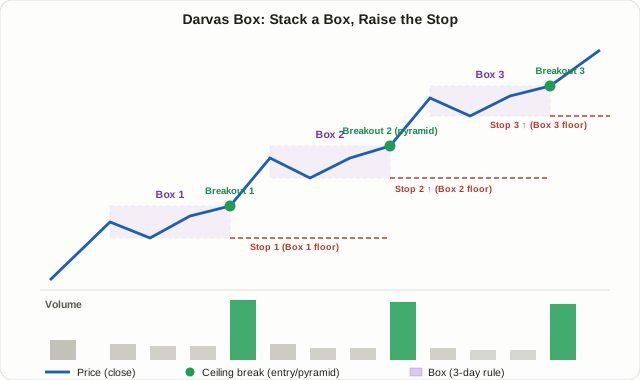
The core idea is simple. When a stock that just hit a new high trades sideways inside a defined price range for a while, treat that range as a "box," and only buy when price clears the top of the box. The part that makes Darvas's method distinct from a plain breakout trade is what happens next: once a new box stacks on top of a successful one, the stop gets raised to the floor of that new box. This "stack a box, raise the stop" cycle is the actual engine of the strategy.
It builds on the same support/resistance breakout logic from Lesson 4, but adds three specific constraints: boxes are only drawn near new highs, a box's edges are confirmed with a 3-day rule, and the stop ratchets upward with each new box stacked on the chart.
Why the Box Works: A Range Where Supply Gets Absorbed
When a stock prints a new high, two groups show up at the same time. Existing holders who bought before the move start eyeing profit-taking, while new buyers who just noticed the stock hesitate, wondering if it's already run too far. While those two forces are roughly balanced, price zigzags sideways inside a narrow range instead of trending — and that sideways range is the box.
The longer that sideways action runs, the more this plays out:
- Existing holders looking to take profit sell in small pieces inside the box, and that supply gets absorbed by new demand near the bottom of the range.
- Sidelined buyers watch the stock neither break down nor run away, gain confidence the longer it holds, and tend to add more each time price revisits the top of the range.
- Repeat that enough times, and the pool of people left who still want to sell at that price shrinks — which means the top of the box (resistance) gets easier to clear even without a huge push of new buying.
A clean break above the box top is really a signal that there's not much supply left sitting at that price. This is the same underlying logic — sell-side supply getting worked through — behind the VCP covered in Lesson 31. The difference is that VCP treats shrinking pullback depth as the core condition, while a Darvas box carries no such requirement — wide or narrow, the only test that matters is whether it passes the 3-day confirmation rule.
Drawing the Box: The 3-Day Confirmation Rule
Constructing a Darvas box follows a fixed sequence:
- Spot a new high. The stock prints a new 52-week or all-time high. Darvas ignored flat or declining markets entirely and only looked at stocks already in a strong uptrend.
- Confirm the ceiling. If price fails to exceed that new high for three straight trading days, that high becomes the box ceiling.
- Confirm the floor. Find the lowest price reached after the ceiling was set. If price doesn't trade below that low for three straight trading days, that low becomes the box floor.
- The box is complete. Everything between the ceiling and floor is treated as noise and ignored until price actually clears one edge or the other.
The "three days" figure itself was a convention Darvas settled on given the weekly-lag data he was working with at the time — it isn't a fixed law of physics today. In practice, many traders adapt the confirmation window to roughly 2-5 days depending on how volatile the individual stock normally is.
Entry: Clearing the Ceiling on Volume
The buy signal is unambiguous — a close above the box ceiling. Darvas had no access to intraday quotes, so he traded strictly off closing prices, and that same close-based convention remains common in daily-chart breakout trading today.
A few checks commonly help confirm the breakout is real rather than a fluke:
- Volume confirmation. Look for the breakout to come with volume noticeably above the recent average. A breakout on thin volume is often just a handful of buyers pushing through a quiet level, which leaves it exposed to a quick reversal back into the box.
- Time spent inside the box. If the box only lasted a few days, supply may not have had enough time to really clear out; if it drags on for months, the move may have already lost its underlying momentum. Weighing both is a standard practical check, not a strict rule.
- Broader market context. Even a clean individual breakout is more likely to fail when the overall market is in a clear downtrend (Stage 4 in Lesson 20's framework) — the same caveat that applies to breakout trading in general.
Stops and Pyramiding: Stacking the Boxes
The stop rule is simple — just below the floor of the box that justified the entry. If that floor breaks, the premise behind the trade (that supply had been exhausted) was wrong, and the position gets closed immediately.
This is where Darvas's method departs from a plain breakout trade. If price keeps climbing after the breakout, prints a fresh new high, and passes the 3-day rule again to form a second box (Box 2):
- The stop moves up from Box 1's floor to Box 2's floor.
- If there's capital to spare, the Box 2 breakout is treated as an opportunity to add to the position (pyramiding).
- If Box 3 stacks on top of Box 2, the stop ratchets up again to Box 3's floor.
Repeat this and the stop trails the price upward step by step, never dropping back below where it was previously set. The moment the trend finally rolls over and some box's floor breaks, the whole position exits having already locked in most of the gains accumulated along the way. Darvas himself summed this up as "cut losses short, let winners run until the trend itself breaks" — which lines up directly with the risk/reward framework in Lesson 6: each individual stop-out stays small, while a winning run compounds across several boxes, so the overall payoff structure can stay favorable even without a high win rate.
One fixed guardrail is worth adding on top of this. If a box turns out so wide that the distance down to its floor exceeds an account's risk limit (commonly something like 8-10% of entry price), the standard practice is to use that fixed percentage as the stop instead of the literal box floor — the same logic behind the min/max stop-distance filters covered in Lesson 13.
A Worked Numeric Example (Simplified, Educational)
The numbers below are a simplified hypothetical example meant to illustrate the mechanics — not a real, backtested trade record.
| Stage | Price | Description |
|---|---|---|
| New high | $40.00 | 52-week high, unbroken for 3 days → ceiling confirmed |
| Box 1 floor | $36.00 | Low after the high, unbroken for 3 days → floor confirmed |
| Box 1 breakout entry | $40.40 | Clears ceiling on a volume surge |
| Stop (initial) | $35.80 | Just below Box 1's floor |
| Box 2 ceiling (new high) | $46.00 | New high, unbroken for 3 days → ceiling confirmed |
| Box 2 floor | $43.00 | Unbroken for 3 days → floor confirmed, stop raised |
| Box 2 breakout, add shares | $46.40 | First pyramid addition |
| Stop (raised) | $42.80 | Just below Box 2's floor |
| Box 3 ceiling (new high) | $54.00 | Further rally, unbroken for 3 days |
| Box 3 floor | $50.00 | Unbroken for 3 days → floor confirmed, stop raised again |
| Exit on stop | $49.80 | Box 3's floor breaks, full position closed |
Looking at the first tranche alone, the initial risk from $40.40 was roughly 11.4% ($4.60). Carried through to the final exit at $49.80, that first tranche gains roughly $9.40 — about a 2x R multiple. Add in the shares added at the Box 2 breakout, and the position's average cost rises while share count also grows, so a bigger overall move amplifies what pyramiding adds on top. Had price instead reversed right after the Box 1 breakout and hit the stop, the loss would have been capped near that 11.4% figure, and no shares would ever have been added.
Darvas Box vs. Turtle Trading (Donchian Channel): What's Different
The Darvas Box gets compared often to the Donchian channel and Turtle Trading system from Lesson 11. Both use the same core logic — buy when price clears the high of some lookback window — and both pyramid into winners while trailing the stop upward. The mechanics underneath differ quite a bit, though.
| Turtle Trading (Donchian Channel) | Darvas Box | |
|---|---|---|
| How the channel is defined | A fixed, rolling N-day high/low (e.g., 20-day, 55-day) | A box confirmed by the 3-day rule after a new high, with no fixed width |
| Where it applies | Mechanically, to any trending stretch, new high or not | Only near confirmed 52-week highs |
| How much judgment is involved | Fully mechanical — just follow the rolling window | A little judgment in confirming the box (interpreting the 3-day rule) |
| How the stop moves | Rolls and adjusts automatically every single day | Steps up once, each time a new box is confirmed |
Turtle Trading is a fully systematized approach built to strip out discretion entirely — every input is a fixed number. The Darvas Box keeps things simpler visually ("new high plus box") but leaves in a small amount of discretion: eyeballing whether a box has actually formed cleanly. Neither is objectively better — a trader who wants full automation tends to prefer the Donchian-style rule, while one who prefers reading price action directly tends to lean toward the Darvas-style approach.
Limitations to Keep in Mind
- Judgment in reading the box. "Unbroken for three days" sounds precise, but deciding where one box ends and whether a minor wiggle counts as a new box leaves real room for different traders to read the same chart differently.
- False breakouts. It isn't unusual for price to close above the ceiling one day and drift right back into the box the next. Checking whether price actually holds above the ceiling for a few more days is a common way to filter these out.
- The information-lag paradox. Part of why Darvas avoided overtrading is often credited to the fact that he simply couldn't watch the ticker all day. In an era of live, constantly-updating charts, the temptation to jump in before a box is even fully confirmed is much stronger — and worth guarding against deliberately.
- Poor fit for violent gaps. Stocks that gap sharply up or down before a box has had time to form don't fit this framework well. Those situations are usually better handled with short-term volatility tools like the ones in Lesson 24 or dedicated gap-trading rules.
FAQ
What timeframe should I use for a Darvas box — daily or weekly?
Darvas himself worked off weekly closing prices, but the most common approach today confirms boxes off daily closes. It can be applied on shorter timeframes too, but boxes form more often at the cost of a higher false-breakout rate, so that tradeoff is worth weighing before going shorter.
Is Darvas Box better than VCP?
Neither is strictly better. VCP treats shrinking pullback depth as its core condition, while a Darvas box has no such requirement — it only needs a new high plus the 3-day confirmation rule, regardless of width. Boxes sometimes do get tighter as they stack, but that's an outcome, not a built-in requirement of the method.
Does this work for crypto or futures?
The box-building logic — confirm a new high, use the 3-day rule to lock in a ceiling and floor, buy the breakout — doesn't depend on the asset class, so it applies in principle to anything that trends. The more volatile the asset, the more it generally makes sense to adjust that 3-day confirmation window to fit its typical swings.
Summary
- The Darvas Box treats a sideways range that forms after a new high as a "box," buying the breakout above its ceiling when it comes with rising volume.
- A box is confirmed by a ceiling (a high unbroken for 3 trading days) and a floor (a low unbroken for 3 trading days) set after that high.
- The stop sits at the box floor, and the core mechanic is raising that stop to a new box's floor every time one stacks on top — that "stack a box, raise the stop" cycle is the backbone of the pyramiding.
- It shares its breakout-channel logic with Turtle Trading/Donchian channels, but only applies near new highs and leaves a bit more room for discretion in confirming each box.
- Real limitations include judgment calls in reading box edges, false breakouts, and a poor fit for violent gaps — which is why checking the broader market trend and setting a risk limit scaled to box width are both worth doing alongside it.