Trading Strategies · Lesson 23/57 · 9 min read
Short Squeeze Trading: Reading Short Interest Ratio and Days to Cover
In this article
- Why Short Selling Can Turn Into Its Own Trap
- The Core Metrics: Short Interest, Short Interest Ratio, and Days to Cover
- The Mechanism: Losses, Margin Calls, and Forced Buying
- A Worked Example
- Short Squeeze vs. Gamma Squeeze: Similar Effect, Different Source
- Where the Data Comes From — and How Stale It Is
- Why Most "Squeeze Candidates" Never Squeeze
- Limitations and Pitfalls
- FAQ
- Summary
Why Short Selling Can Turn Into Its Own Trap
Short selling is a bet on a falling price: borrow shares, sell them first, and buy them back later (cover) at a lower price to pocket the difference. But the position carries a structural weakness a long position never has — the loss is theoretically unbounded. A buyer's worst case is losing 100% of what they put in. A short seller's loss grows without limit as the price keeps climbing.
That asymmetry is what produces a short squeeze. When a heavily shorted stock starts moving up instead of down, short sellers have to buy shares to cover and cap their losses. But that buying is itself demand, which pushes the price up further — which then pressures the shorts who haven't covered yet. A position that started as selling pressure ends up generating its own buying pressure in a self-reinforcing loop. This lesson covers the two metrics traders lean on to gauge how strong that loop is likely to be if it fires: short interest ratio and days to cover.
The Core Metrics: Short Interest, Short Interest Ratio, and Days to Cover
Screening for squeeze candidates comes down to quantifying two things: how much short exposure is currently outstanding, and how long it would take to unwind.
| Metric | How it's calculated | What it tells you |
|---|---|---|
| Short interest | Total shares currently sold short and not yet covered | The raw size of the outstanding short position |
| Short interest as % of float | Short interest ÷ shares in the public float | How much of the tradable supply is committed to a bearish bet |
| Days to cover (DTC) | Short interest ÷ average daily volume | How many trading days it would take, at current volume, to buy back the entire short position |
Of the three, percent-of-float and days to cover get cited most often in practice. A high percent-of-float tells you how many market participants are betting against the stock. A high DTC tells you something different — how narrow the exit is if those bets have to unwind at once. The ranges below are conventions widely repeated among traders, not fixed thresholds, and vary by data provider:
| Zone | % of float short | Days to cover | Read |
|---|---|---|---|
| Low | Under 5% | Under 2 days | Little short-side pressure on the stock |
| Watch | Around 10% | 3–5 days | Worth tracking for squeeze potential |
| Extreme | 20%+ | 10+ days | The range commonly cited around well-known meme-stock squeezes |
💡 The two metrics measure different things. A stock can carry a high percent-of-float but still have a low DTC if daily volume is huge (a wide exit), while a stock with a moderate percent-of-float but thin daily volume can post a very high DTC (a narrow exit). Reading them together tells you both the size of the pressure and how tight the bottleneck is.
The Mechanism: Losses, Margin Calls, and Forced Buying
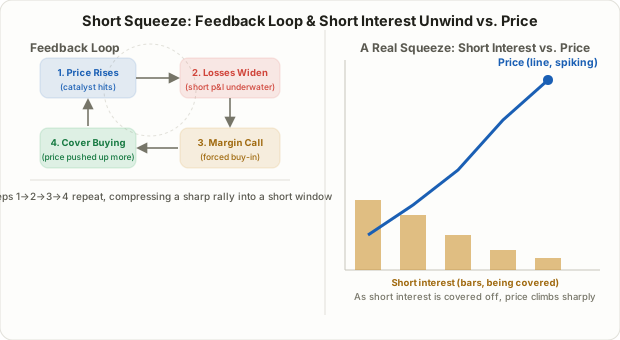
A short squeeze typically plays out in a fairly consistent sequence:
- The price turns up against the trade — often triggered by an earnings beat, acquisition rumor, or a wave of coordinated retail buying.
- Mark-to-market losses on the short position grow quickly. Because short selling requires a margin account, losses past a certain point trigger a margin call.
- If the account can't post additional collateral, the broker force-liquidates the position — a buy-in executed at market, regardless of what the trader wants.
- That forced buying pushes the price up further, deepening the losses of shorts who haven't covered yet, which restarts the cycle from step 2.
A few passes through this loop in quick succession is what produces the vertical price moves associated with squeezes. There's a second amplifier as well: as available shares to borrow shrink, the cost to borrow (borrow fee) on hard-to-borrow names spikes. Some shorts close out purely because the carrying cost has become punishing, independent of their view on the stock — adding yet another source of buying pressure in the same direction.
A Worked Example
Consider a hypothetical Stock C:
- Public float: 40 million shares
- Short interest: 8 million shares
- Average daily volume: 1 million shares
Percent of float short comes to 8M ÷ 40M = 20%, squarely in the "extreme" zone above, and days to cover is 8M ÷ 1M = 8 days, well past the watch threshold. Now suppose Stock C reports a surprise earnings beat and gaps up the next morning. Shorts who are already underwater from the opening bell are exposed to margin calls and stop-outs throughout the session — exactly the conditions that make continued forced buying likely.
That said, 20% short and an 8-day DTC don't guarantee a squeeze on their own. These numbers describe a stock that would likely squeeze hard if a catalyst ignites it — not that a catalyst is coming. Plenty of stocks sit at extreme short interest levels for months, even years, without ever squeezing.
Short Squeeze vs. Gamma Squeeze: Similar Effect, Different Source
If you've read Lesson 15 on gamma exposure (GEX), it's easy to conflate a short squeeze with a gamma squeeze — both produce forced buying that accelerates a rally, and famous cases like GameStop in 2021 saw both mechanisms firing at once. But the source of the buying pressure is genuinely different.
| Aspect | Short Squeeze | Gamma Squeeze |
|---|---|---|
| Who's forced to buy | Short sellers themselves (or their broker, via forced liquidation) | Options market makers who sold calls |
| Why the buying happens | Mounting losses trigger margin calls and buy-ins; borrow costs spike | Delta hedging — as calls move toward in-the-money, dealers must buy the underlying to stay delta-neutral |
| What you'd screen for | Short interest %, days to cover, borrow fee | Call open interest, GEX, delta/gamma exposure |
| Conditions to trigger | Rising price + shorts underwater | Rising price + heavy call buying + short time to expiration |
| How it fades | Buying pressure ends once the short position is largely covered | Buying pressure ends once expiration passes or dealer delta rebalances |
Both squeezes share the same surface-level result — rising price manufactures its own buying — but one originates from short sellers protecting against loss, the other from options dealers meeting a risk-management obligation. When both conditions line up on the same stock (heavy short interest plus a surge of call buying), the two forces can reinforce each other, and some of the most extreme squeeze moves on record involved exactly that combination.
Where the Data Comes From — and How Stale It Is
One practical wrinkle traders often overlook: reporting lag. In the US, FINRA compiles short interest only twice a month, as of settlement dates around the 15th and the last business day, with the actual release coming roughly a week or more after that. The percent-short figure you're looking at right now could reflect a snapshot from one to two weeks ago, not today.
Markets with more frequent disclosure requirements exist too — some regulators require next-day publication once a stock's short position crosses a defined threshold. Reporting cadence and thresholds differ by market, so it's worth confirming the actual disclosure schedule for whatever exchange you're trading before relying on the number.
Why Most "Squeeze Candidates" Never Squeeze
Lists of high-short-interest stocks are easy to find online, but the majority of names on them never see a dramatic squeeze — they either drift sideways for a long stretch or keep grinding lower. The reason is straightforward: heavy short interest usually means a large number of informed traders have real conviction that the stock is overvalued. If the underlying business is genuinely weak, there's often not enough buying interest available to overpower persistent selling, no matter how crowded the short side gets.
A real squeeze needs both pieces — the structural setup (elevated short interest and days to cover) and an actual catalyst capable of pushing price up in the first place (earnings, news, a coordinated wave of buying). Finding the structural setup tells you where the powder keg is; it doesn't tell you whether or when a spark reaches it.
Limitations and Pitfalls
- Timing is unknowable. High short interest and DTC describe potential, not a schedule. Plenty of stocks stay elevated for months without a catalyst ever showing up.
- Data lag is real. US short interest reporting runs on a two-week cycle, which limits how close to real time this analysis can be. Watching the borrow fee for sudden spikes is one way to partially compensate.
- Weak fundamentals are common among candidates. Stocks with extreme short interest are frequently there because the business itself is troubled. A squeeze can produce a sharp spike, but the stock often reverts to its prior downtrend once the catalyst fades.
- Volatility is extreme. Prices in a squeeze can move dozens or hundreds of percent in hours, which makes the discipline from Lesson 6 on risk/reward and position sizing unusually hard to hold onto. Set your stop and position size before entry, not during the move.
- The reversal can be just as violent. Once forced buying is exhausted, the buying pressure disappears with it, and prices frequently give back gains as fast as they were made. Chasing a squeeze after it's already extended is especially risky.
FAQ
Where can I check a stock's short interest ratio?
For US stocks, FINRA's biweekly short interest release is repackaged and shown free on most major financial data sites. Other markets publish their own short-position disclosures through their exchange or regulator; the reporting frequency and threshold rules vary, so always confirm the as-of date on whatever figure you're looking at.
Which matters more, percent of float or days to cover?
Neither on its own is enough. Percent of float shows how much capital is betting against the stock; days to cover shows how quickly that capital could be forced to exit. The combination of both being elevated is the setup most often cited as having the strongest theoretical squeeze potential — but that's potential, not a guarantee.
Is it worth buying and holding a high-short-interest stock just in case it squeezes?
Holding purely on the strength of short interest and DTC numbers, with no catalyst in sight, means carrying both the opportunity cost and the downside risk of a stock the market may have correctly priced as weak. In practice, traders more commonly wait for a catalyst to actually move the price first, then enter alongside technical confirmation like a volume surge or resistance breakout.
Summary
- A short squeeze is a feedback loop where a rising price forces short sellers to buy back shares to limit losses, and that buying itself pushes the price up further.
- Percent of float short measures the size of the pressure; days to cover measures how narrow the exit is — they're two different axes and should be read together.
- 20%+ short and 10+ days to cover are commonly cited as an "extreme" zone, but these are trader conventions, not industry standards, and they describe potential rather than a guarantee.
- A short squeeze is driven by short sellers' loss-avoidance behavior, while a gamma squeeze is driven by options dealers' delta-hedging obligations — different mechanisms that can amplify each other when both line up on the same stock.
- US short interest data lags by roughly two weeks due to biweekly reporting, so always check a market's actual disclosure cadence before trusting how current the number is.
- Most high-short-interest stocks never squeeze, and many carry weak fundamentals to begin with, so this analysis should always be paired with a firm stop-loss and position-sizing plan.