Trading Strategies · Lesson 66/66 · 11 min read
Triangle, Flag, and Pennant Patterns: Trading Continuation Breakouts and Price Targets
In this article
- Continuation Patterns: A Pause, Not an End
- The Three Triangle Types: Ascending, Descending, and Symmetrical
- Flags and Pennants: A Brief Breather After a Sharp Move
- Triangles vs. Flags and Pennants: What Actually Differs
- Calculating the Target: Different Height, Same Measured-Move Logic
- Reading Breakout Quality Through Volume
- A Practical Checklist: Entry, Stop, and Target
- FAQ
- Limitations and Caveats
- Summary
Continuation Patterns: A Pause, Not an End
Every pattern covered so far in this course — head and shoulders (Lesson 43), cup and handle (Lesson 49), harmonic patterns (Lesson 46) — reads either exhaustion or a base being built. Triangles, flags, and pennants belong to a different family entirely. These are continuation patterns: shapes that show up mid-trend and suggest the existing move is likely to resume in the same direction once the pause ends, rather than reverse.
The logic behind why they form is straightforward. After a strong directional move, some traders who rode that move start banking profits, while traders on the other side tentatively step in, betting on at least a small pullback or bounce. These two forces cancel each other out for a while, and price either grinds sideways in a narrowing range or drifts in a short, shallow counter-trend move. But if the force that drove the original trend hasn't actually been exhausted — just paused — then once this tug-of-war resolves, the leftover pressure typically pushes price right back in its original direction. Triangles, flags, and pennants are really just labels for different shapes this pause can take.
One tendency shows up across all three: volume tends to contract while the pattern is forming, then expand sharply on the breakout. This isn't a statistically validated law so much as a widely observed pattern in its own right, but it remains one of the most commonly used checks for gauging whether a breakout is likely to hold.
The Three Triangle Types: Ascending, Descending, and Symmetrical
A triangle forms when price gets squeezed between two converging trendlines — one on top, one on the bottom — and the range narrows over time. The slope of each line determines which of three types you're looking at, and each type carries a different directional bias.
| Type | Resistance line | Support line | Commonly expected breakout direction | Psychological read |
|---|---|---|---|---|
| Ascending triangle | Flat (repeated rejection at the same level) | Rising (each low higher than the last) | Upside | Sellers keep offering at the same price, but buyers show growing urgency by paying progressively higher prices |
| Descending triangle | Falling (each high lower than the last) | Flat (repeated support at the same level) | Downside | Buyers keep defending the same level, but sellers show growing urgency by accepting progressively lower prices |
| Symmetrical triangle | Falling | Rising | Ambiguous (breakout in the direction of the prior trend is cited more often) | Neither side has conviction; both are testing the other |
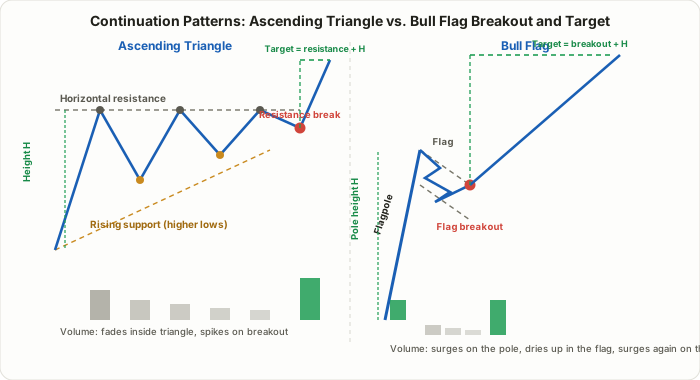
The resistance line is the interesting part of an ascending triangle. Repeated rejection at the exact same price is often read as a sign that a large pool of supply — stop-loss orders, breakeven exits, whatever — sits right at that level. The fact that lows keep rising anyway suggests buyers are absorbing that supply bit by bit and are increasingly willing to pay up for it. Once that supply is fully absorbed, a break above resistance is often treated as only a matter of time. A descending triangle is the same logic flipped upside down.
Of the three, a symmetrical triangle gives the weakest directional read on its own. In practice, though, a widely cited rule of thumb holds that a symmetrical triangle tends to break in the direction of the trend that was already in place before it formed — an uptrend produces an upside break more often than not, and vice versa. This is an observed tendency, not a validated statistic, so it's safer to treat it as a lean rather than a prediction and wait for the actual break to confirm direction.
Flags and Pennants: A Brief Breather After a Sharp Move
Unlike triangles, flags and pennants come with a precondition: they only form right after a near-vertical move, up or down. That sharp initial move is called the "flagpole," and the short consolidation that follows it is either a "flag" or a "pennant," depending on its shape.
- Flag: the consolidation forms a channel between two roughly parallel trendlines. After an upward pole, the flag usually slopes slightly downward (or drifts sideways); after a downward pole, it slopes slightly upward.
- Pennant: the consolidation converges into a small symmetrical triangle instead of a parallel channel. A pennant is, in effect, a miniature symmetrical triangle — structurally a hybrid between the triangle family and the flag family.
The psychology behind both is the same. The pole moved so fast that traders who missed the initial move use the consolidation as a second chance to get in, while the handful of traders caught on the wrong side use the brief counter-move to cut losses or lock in gains. What separates this from a triangle is how quickly that tug-of-war resolves — typically within days, rarely more than a couple of weeks. If the pullback runs deeper than roughly half the flagpole's length, or drags on far longer than that, it's often read less as a pause and more as a sign the trend itself may be rolling over.
Triangles vs. Flags and Pennants: What Actually Differs
Both families share the same broad playbook — consolidate, then break out on a volume surge — but the practical details worth separating are real.
| Triangles (ascending/descending/symmetrical) | Flags and pennants | |
|---|---|---|
| Precondition | Can form during a gentle trend or even a sideways market | Only forms right after a near-vertical pole |
| Duration | Longer (weeks to months) | Shorter (days to a few weeks, typically) |
| Depth of pullback | Relatively wide | Shallow (often cited as staying within ~50% of the pole) |
| Directional bias | Ascending/descending are fairly clear; symmetrical is ambiguous | More often cited as continuing the pole's direction |
| Volume behavior | Gradually fades as the triangle narrows | Spikes on the pole, dries up fast during the flag/pennant |
| Target basis | The triangle's own height (H), measured at its widest point | The flagpole's height (H) |
The most common point of confusion in practice is telling a small symmetrical triangle apart from a pennant. The distinguishing question is simple: was there a near-vertical pole right before the consolidation started? If yes, and the consolidation is short and shallow, call it a pennant. If the consolidation built up gradually with no sharp pole beforehand, it's a symmetrical triangle. Either way, the trading logic — wait for a volume-backed break — is identical, so getting the label exactly right matters far less than reacting correctly to the breakout itself.
Calculating the Target: Different Height, Same Measured-Move Logic
Both pattern families use the same measured-move principle introduced in Lesson 43 (head and shoulders) and Lesson 49 (cup and handle), but they disagree on what counts as the height (H).
For triangles: measure the vertical distance at the point where the triangle is widest (its starting point), and project that same distance from the breakout point in the direction of the break.
Worked example (ascending triangle): suppose a stock's triangle starts with resistance at $50 and an initial support low at $44 — a height H of $6. As the lows climb to $45, then $47, price eventually breaks above the $50 resistance on a volume surge. The measured-move target becomes resistance ($50) + H ($6) = $56.
For flags and pennants: measure the vertical distance of the pole itself, from where the sharp move started to its peak (or trough), and project that same distance from the point where the flag or pennant is broken.
Worked example (bull flag): suppose a stock rallies sharply from $30 to a flagpole high of $42 — a pole height H of $12. It then consolidates in a narrow declining channel between roughly $40 and $41.50 for several days before breaking above $41.50 on rising volume. The measured-move target becomes the breakout price ($41.50) + H ($12) = $53.50.
⚠️ Both calculations are rules of thumb, not guarantees. Plenty of triangles and flags fall well short of their projected target, and plenty overshoot it and go straight into forming another continuation pattern. As covered in Lesson 6's Risk/Reward and Money Management, treat this number as a reference for sizing risk/reward, and manage the actual exit with a trailing stop or scaled-out approach rather than a single fixed target.
Reading Breakout Quality Through Volume
The volume curve matters almost as much as the shape itself. The same principle from Lesson 31's VCP (Volatility Contraction Pattern) — volume contracting alongside price range — applies equally here.
- While the pattern is forming: volume gradually thinning out is the ideal sign, read as participants shifting to the sidelines rather than actively trading.
- On the breakout: a clear pickup relative to the recent average (commonly a 20- to 50-day baseline) is the widely used confirmation. A breakout on light volume is generally treated as more prone to failing, since it suggests demand or supply hasn't genuinely shifted.
- After the breakout: consistent with the support-turns-resistance logic from Lesson 4's Support, Resistance, and Breakout Trading, price often retests the broken trendline (or the flag's lower boundary) before continuing. Volume typically fades during that retest, which is usually read as a normal, healthy pullback rather than a warning sign.
A Practical Checklist: Entry, Stop, and Target
- Confirmation: require a closing break of resistance (or the flag's upper boundary) rather than a brief intraday poke through it.
- Entry timing: entering immediately on the break captures the full distance to target; waiting for a retest allows a tighter stop, at the cost of sometimes missing the trade if price never comes back.
- Stop-loss: for triangles, place it beyond the opposite trendline; for flags and pennants, beyond the far side of the flag's channel. The logic is that a genuinely valid breakout shouldn't need price to trade back through that level.
- Volume confirmation: always check that volume on the breakout candle clearly exceeds the recent average.
- Pattern shelf life: a triangle that drags on until the two trendlines nearly meet at the apex is often considered to have lost most of its breakout force — a break somewhere around two-thirds to three-quarters of the way through the triangle's full length is generally viewed as more reliable. Flags and pennants that stretch well past a couple of weeks are similarly viewed as less trustworthy.
FAQ
Which way does a symmetrical triangle actually break more often?
There's no officially validated fixed probability. The widely cited rule of thumb is simply that breaks tend to continue the trend that was already underway before the triangle formed — but that's an observed tendency, not a guarantee. Rather than assuming a direction in advance, it's safer to wait and see which trendline actually breaks on a closing basis before entering.
It's hard to tell a pennant from a symmetrical triangle in real time — does it matter?
Not much. Both patterns follow the same core logic: wait for a volume-backed breakout after consolidation. It's still worth checking whether a near-vertical move preceded the consolidation, since a genuine pole tends to mean the pause resolves faster and shallower than a triangle without one.
How reliable are these patterns in practice?
There's no officially validated, fixed success-rate statistic for any of them — results vary enormously by market regime, timeframe, and exactly how strictly you define confirmation, so treat any specific percentage you see quoted online as unverified. Read these patterns as one input suggesting the trend is likely to resume, never as a standalone predictive tool, and always pair them with volume confirmation and a defined stop-loss.
Limitations and Caveats
- Subjectivity: there's no universal rule for exactly where a trendline should start or end, so two traders can draw meaningfully different patterns on the same chart.
- Fakeouts: price briefly poking through resistance or a flag's upper boundary and then snapping back inside the range is common. Entering on shape alone, without a closing confirmation and a volume check, is how traders get caught in these traps.
- Crowding risk: because these are such widely known, widely taught patterns, large numbers of traders tend to cluster stops and entries around similar levels, which can make those exact zones attractive targets for larger participants to sweep through.
- Context still matters: a textbook-perfect continuation pattern on an individual stock can still fail if the broader market or sector is moving forcefully in the opposite direction. As covered in Lesson 26's RRG Sector Rotation, checking the broader trend alongside the individual setup is worth the extra step.
Summary
- Triangles, flags, and pennants are continuation patterns — they signal a pause in an existing trend, not a reversal.
- Triangles split into ascending (flat resistance, rising support), descending (falling resistance, flat support), and symmetrical (both converging); the first two carry a clearer directional bias than the third.
- Flags and pennants only form after a near-vertical flagpole; a parallel channel afterward makes it a flag, a small symmetrical triangle makes it a pennant.
- Both families use the measured-move method for a target, but triangles measure the pattern's own height while flags and pennants measure the flagpole's height.
- Expect volume to contract during formation and expand on the breakout in both cases; always require a closing break and a defined stop-loss before treating the pattern as confirmed.
- Neither family has a validated fixed success rate — check the broader market and sector trend alongside the individual pattern, and manage risk with the same discipline as any other setup.