Trading Strategies · Lesson 21/57 · 8 min read
Wyckoff Method: Reading the Accumulation Schematic and Spring Pattern
In this article
Why Wyckoff, and Why Now
Lesson 7 introduced PO3 and Confirm DOL — a three-phase rhythm of Accumulation, Manipulation, and Distribution. That three-phase model didn't originate with ICT. Richard Wyckoff described the same underlying phenomenon — large operators absorbing supply, shaking out weak hands, then marking price up — in far more granular detail back in the 1930s. Crypto communities and TradingView chart annotations still reference "Wyckoff accumulation" and the "Spring phase" constantly, nearly a century later, which says something about how durable the framework has proven in practice.
Where PO3 compresses Wyckoff's logic into a fast, intraday-friendly three-step model, this lesson covers the original five-phase structure (Phase A through E), each with named sub-events — Preliminary Support, Selling Climax, Spring, Sign of Strength, and more. For swing and position trading, it's a finer-grained tool for answering a specific question: is this range genuinely being accumulated, or is the downtrend not actually over yet?
Three Laws and the Composite Operator
The entire method rests on three laws.
- Law of Supply and Demand: price rises when demand overwhelms supply and falls when supply overwhelms demand. Obvious on its face, but Wyckoff's point was that this should be read through the relationship between price and volume, not price alone.
- Law of Cause and Effect: the size of a subsequent move (the "effect") is proportional to how long and how wide the preceding accumulation or distribution (the "cause") was. A breakout out of a narrow, brief range tends to travel less far than one out of a wide range that took months to build.
- Law of Effort vs. Result: volume ("effort") and the resulting price change ("result") should move in proportion. Heavy volume with little price progress is a mismatch — read as evidence that a large operator is absorbing supply on the other side.
Behind all three sits the Composite Operator (often called the Composite Man): the idea of treating the market's many individual participants as if they were one large, deliberate actor whose footprints can be read on the chart. It's functionally the same concept as ICT's "smart money," except Wyckoff analysis leans more heavily on volume and the shape of a broad trading range than on price structures like order blocks or FVGs.
The Accumulation Schematic: Five Phases
Wyckoff's accumulation schematic breaks the process of a large operator quietly building a position after a downtrend into five phases, each with specific named events.
| Phase | Key events | What's happening |
|---|---|---|
| A | PS (Preliminary Support), SC (Selling Climax), AR (Automatic Rally), ST (Secondary Test) | The prior downtrend starts to stall; SC absorbs a volume-heavy panic sell-off |
| B | Repeated swings inside the range | "Cause" is built; supply gets tested repeatedly from both sides |
| C | Spring (or Shakeout) + Test | Price briefly breaks below range support to flush out the last weak holders |
| D | SOS (Sign of Strength) + LPS (Last Point of Support) | Range resistance breaks on strong volume; a shallow pullback finds support |
| E | Markup | Price leaves the range behind and trends higher |
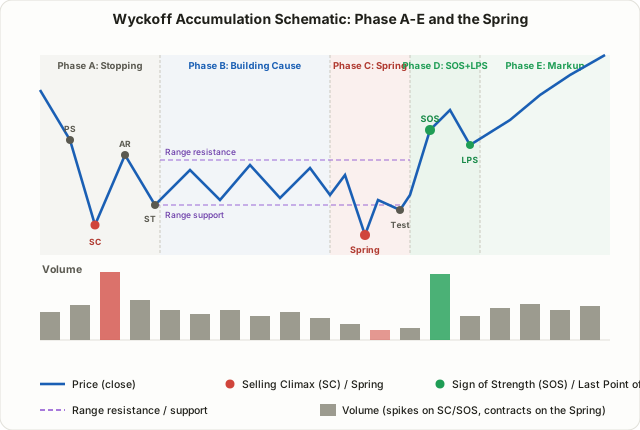
Phase A is where the prior downtrend first meets real resistance. The Selling Climax brings a volume spike as panicked selling gets absorbed — read as the Composite Operator stepping in to take the other side. Phase B is where "cause" accumulates through repeated swings inside the range; per the Law of Cause and Effect, a wider and longer Phase B is generally read as building potential for a larger eventual move.
Why the Spring Works
Phase C's Spring is both the most-cited and most-misunderstood event in the schematic. It's a brief break below range support that quickly reclaims the range.
The mechanics are functionally identical to the liquidity sweep covered in Lesson 5's ICT material. Range support tends to accumulate two kinds of resting orders: stop-losses from buyers who bought inside the range, and fresh short entries from traders betting on a breakdown. A brief poke below that level triggers both at once, dumping supply into the market — supply the Composite Operator is positioned to absorb. Read through the Law of Effort vs. Result, the "effort" of pushing price lower produces almost no further "result" before price snaps back, which is read as evidence that available supply has largely run out.
Springs are often confused with the more violent Shakeout. A Spring is a relatively quiet, narrow break; a Shakeout is sharper and comes with heavier volume, read as an attempt to force out not just remaining sellers but latecomers on the wrong side of a stop-run. In practice, the two aren't always worth separating cleanly — the shared tell is a quick break, a fast reclaim, and volume that drops off right after. If price breaks down and simply stays down instead of reclaiming the range, that's not a Spring — it's the range genuinely failing.
The Test that follows Phase C revisits the Spring's low on noticeably lighter volume than the Spring itself produced — read as confirmation that selling pressure has actually been exhausted, not just paused.
A Worked Example
Suppose stock F fell to $12.00 over six months, then has spent three months ranging between $9.00 and $10.50. Early in that range, a sharp drop and rally near $9.00 came on roughly 3x average volume (SC and AR), followed by two months of back-and-forth inside the range (Phase B).
One session, price briefly dips to $8.75 — below the $9.00 range low — before closing back at $9.15, on volume just 0.8x the trailing 20-day average. That's the textbook Spring signature: a brief break, a fast reclaim, and volume that's lighter, not heavier. Over the next three sessions price holds above $9.00 on thinning volume (the Test). The following week, price clears the $10.50 range high on 2.5x average volume and closes at $11.20 (SOS), then pulls back shallowly to around $10.70 (LPS) before resuming higher — a textbook run through Phases A to D.
Entering just after the Spring, at $9.15, and placing a stop per Lesson 6's Risk-Reward and Money Management framework slightly below the Spring low — say $8.65 — puts risk at roughly $0.50 per share. That produces a favorable risk-reward if the LPS-to-markup move is used as a target, but that ratio belongs to this one hypothetical scenario, not a general statistic for how Springs perform.
Distribution: The Mirror Image
Distribution is accumulation run in reverse — the phase after an advance where the Composite Operator quietly transfers a position to late buyers. The Spring's counterpart here is the Upthrust (UT): a brief push above range resistance that reclaims the range, drawing in late buyers who get sold into. A subsequent Sign of Weakness (SOW) — range support breaking on heavy volume — marks the start of markdown. The structure is essentially the accumulation schematic flipped vertically, so understanding one gives you the other for free.
Wyckoff vs. PO3: What's Actually Different
| Lesson 7: PO3/Confirm DOL | Wyckoff Schematic | |
|---|---|---|
| Base unit | 3 phases (Accumulation–Manipulation–Distribution) | 5 phases (A–E) plus named sub-events |
| Primary lens | Price structure (liquidity, FVGs) | Price structure + volume (effort vs. result) |
| Best-fit timeframe | Minutes to hours, day trading | Daily to weekly, swing to position |
| Fakeout event | Manipulation | Spring / Upthrust |
| Confirmation tool | LTF re-confirmation, kill zone timing | Volume contraction on the Test, SOS/SOW |
The two aren't competitors — they're the same underlying phenomenon read at different levels of granularity and different timeframes. A common practical combination is using the Wyckoff schematic on daily-to-weekly charts to judge whether a range looks like it's approaching Phase C, then narrowing the actual entry timing with the lower-timeframe confirmation steps from PO3 and Confirm DOL.
Limitations
- The schematic is a teaching idealization. Real charts are messier — a Spring can appear twice, or be skipped entirely on the way to SOS.
- Phase boundaries look far clearer in hindsight than in real time. Confidently telling Phase B from an ongoing downtrend, live, is genuinely hard.
- In markets with unreliable volume data (some crypto exchanges, thinly traded small caps), the Law of Effort vs. Result gets distorted.
- This is an empirical framework passed down and observed by practitioners over decades, not a statistically validated edge. A move that looks like a Spring can simply be the start of a genuine range breakdown.
FAQ
Is a Spring the same thing as a stop hunt?
Functionally, yes, in most practical usage. "Stop hunt" is the informal name traders use for the same mechanism; Wyckoff terminology further splits it into a quieter Spring and a more violent Shakeout.
Does the Wyckoff method only apply to stocks?
No. It was developed by observing stock tape, but the same logic applies to any market with price and volume — crypto, futures, forex. Crypto communities in particular reference these schematics heavily.
Is a Spring alone enough to buy?
Not on its own. The framework's intended sequence is to wait for the lighter-volume Test that follows the Spring, then the volume-backed SOS breakout, before entering. A Spring by itself doesn't rule out a false signal.
Summary
- The Wyckoff method treats the market as being driven by a Composite Operator acting under three laws: Supply and Demand, Cause and Effect, and Effort vs. Result.
- The accumulation schematic maps the process across five phases, from Phase A (downtrend stalling) to Phase E (markup), with the core entry evidence sitting in Phase C's Spring and Phase D's SOS plus LPS.
- A Spring works by shaking out stop-losses and fresh shorts resting below range support, then absorbing the resulting supply — mechanically the same phenomenon as an ICT liquidity sweep.
- The distribution schematic mirrors accumulation, with the Upthrust and Sign of Weakness playing the Spring's and SOS's opposite roles.
- Where Lesson 7's PO3/Confirm DOL is a fast, intraday execution model, the Wyckoff schematic is best understood as the original, more granular framework for reading the same phenomenon on longer timeframes.