Trading Strategies · Lesson 100/100 · 10 min read
Yield Curve Steepener and Flattener Trades: How to Trade the 2s10s Spread
In this article
- Trading the Shape of the Curve, Not Its Direction
- Four Scenarios: Bull/Bear Steepeners and Bull/Bear Flatteners
- Why It Works: Two Different Forces Pull on the Curve
- Building the Trade: Going Duration-Neutral to Isolate the Spread
- A Worked Example (Illustrative, Not Live Market Data)
- Carry, Rolldown, and the Risks You Need to Know
- FAQ
- Summary
Trading the Shape of the Curve, Not Its Direction
Almost every strategy covered so far in this course reduces to one question: will the price go up or down? Bond desks ask a different question entirely. They watch the shape of the Treasury yield curve — whether the gap between short-term and long-term yields is widening or narrowing — and trade that gap directly. The spread between 2-year and 10-year Treasury yields, known as the 2s10s spread, has been one of the most consistently discussed positions among macro funds through the deep inversion of 2022–2023 and the renormalization that followed in 2024–2026. This lesson covers what a steepener or flattener trade actually is, why it carries a fundamentally different risk than simply betting rates will rise or fall, and how to approach it through either Treasury futures spreads or an ETF-based alternative. It belongs to the same family of rate-positioning lessons as the COT report (Lesson 51) and the carry trade (Lesson 93), but what's actually being traded here is a maturity spread, not a directional view.
Four Scenarios: Bull/Bear Steepeners and Bull/Bear Flatteners
The fastest way to understand curve trades is to separate two things that usually get conflated: the direction of rates (up or down) and the shape change of the curve (steepening or flattening). Combining them gives four distinct regimes.
| Scenario | What happens | Typical backdrop |
|---|---|---|
| Bull steepener | Short yields fall faster than long yields | Markets price in aggressive central bank rate cuts |
| Bear steepener | Long yields rise faster than short yields | Heavier Treasury issuance, deficit worries, rising term premium |
| Bull flattener | Long yields fall faster than short yields | Recession fear pushes money into long-duration safe havens |
| Bear flattener | Short yields rise faster than long yields | Central bank tightens more aggressively than expected |
A steepener is a bet that the 2s10s spread widens; a flattener bets it narrows. The useful part is that a steepener trader is largely indifferent to which of the two steepening paths (bull or bear) actually plays out, because — as the next section shows — a properly constructed duration-neutral spread cancels out a parallel move in rates and leaves only the spread change as P&L. The 2022 hiking cycle produced an extreme bear flattener that pushed 2s10s deeply negative; the 2024–2026 period, with rate-cut expectations fighting fiscal-deficit and issuance concerns, turned the renormalization back toward positive territory into one of the more closely watched macro trades of the stretch.
Why It Works: Two Different Forces Pull on the Curve
The curve's shape is really the outcome of a tug-of-war between two distinct forces.
First, the short end is tied closely to the expected path of the policy rate. A 2-year yield is, roughly, the market's bet on where the central bank will keep its policy rate on average over the next two years. When rate-cut expectations build, the 2-year yield tends to move down quickly to reflect that.
Second, the long end is driven by policy expectations plus something else entirely: the term premium. The term premium is the extra compensation investors demand for locking up money for a long time, and it swings with how much new supply the government is issuing to fund its deficit, whether there are enough buyers to absorb that supply, and how worried the market is about inflation resurfacing years down the road. When these two forces point the same way, the curve's behavior is fairly easy to explain. When they pull in opposite directions — say, the central bank is cutting while heavy long-end issuance pushes term premium up — a steepening move can be a bull steepener and a bear steepener at the same time, and commentators genuinely disagree about which force is driving it. Through 2025, as the 2s10s spread moved from under 20 basis points to roughly 70 basis points before stalling, both explanations — rate-cut-driven bull steepening and issuance/term-premium-driven bear steepening — were offered simultaneously, which is a fair illustration of how tangled this can get.
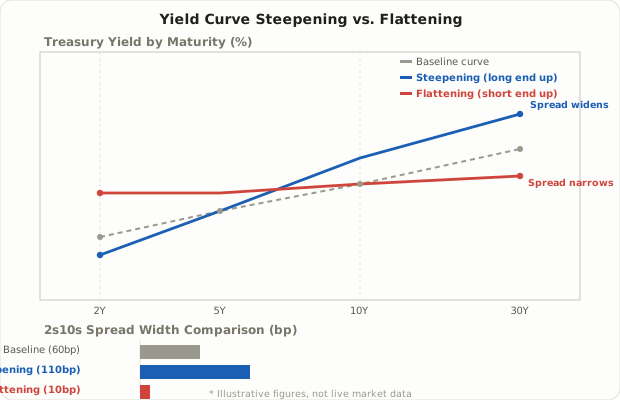
Building the Trade: Going Duration-Neutral to Isolate the Spread
The core of a steepener or flattener trade is sizing the two legs so a parallel move in rates cancels out, leaving only the change in the spread between the two maturities as your P&L. The tool for this is DV01 (dollar value of 01), the dollar change in a position's value for a 1 basis point (0.01%) move in yield.
Longer maturities have more duration, so a given dollar amount of a 10-year note has a much larger DV01 than the same dollar amount of a 2-year note. Simply buying and selling equal dollar amounts at the two maturities would leave you effectively holding a long-end directional bet in disguise. A DV01-neutral curve trade corrects for this by sizing the short-maturity leg larger to match the long-maturity leg's dollar sensitivity.
The most commonly traded Treasury futures combinations are:
- The TUT spread: 2-year note futures (ZT) against 10-year note futures (ZN) — the classic "2s10s" curve trade.
- The NOB spread: 10-year note futures (ZN) against 30-year bond futures (ZB) — used to isolate term-premium shifts further out on the curve.
- The FIT spread: 5-year note futures (ZF) against 10-year note futures (ZN) — a way to trade the belly of the curve.
Retail traders without a futures account can approximate the same exposure with a Treasury ETF pair trade — for example, buying a short-duration Treasury ETF (such as SHY, holding 1–3 year notes) against selling (or using an inverse fund in place of) a longer-duration ETF (such as IEF or TLT). The two approaches are genuinely different tools, not interchangeable:
| Comparison | Treasury futures spread (TUT/NOB/FIT) | ETF pair trade (SHY vs. IEF/TLT) |
|---|---|---|
| DV01-matching precision | Can be tuned precisely, contract by contract | Only approximate, scaled by ETF duration ratios |
| Leverage | High — small margin controls large notional exposure | Low — exposure is roughly your dollar amount invested |
| Shorting the long leg | Straightforward — simply sell the futures contract | Needs an inverse bond ETF or a margin short, less accessible |
| Costs and tracking | Tight spreads, CME margin offsets for correlated legs | ETF expense ratios, bid/ask spreads, and tracking error between the two funds |
| Barrier to entry | Requires a futures account and margin — mostly professional | Available through an ordinary brokerage account |
The trade-off is straightforward: futures give you precision and capital efficiency at the cost of a higher barrier to entry, while ETFs are accessible to anyone but make exact duration-neutrality harder to nail down.
A Worked Example (Illustrative, Not Live Market Data)
The following is a hypothetical, illustrative example meant only to show how DV01-neutral sizing turns into P&L — it is not a live market quote. Suppose a 2-year note future (ZT) has a DV01 of roughly $36 per contract, and a 10-year note future (ZN) has a DV01 of roughly $74 per contract (actual DV01 moves with yield levels and coupons, so check a broker's or exchange's current DV01 calculator before sizing a real trade). To match sensitivities, divide: 74 ÷ 36 ≈ 2.1, meaning roughly 2 ZT contracts per 1 ZN contract gets you close to duration-neutral.
Say you expect steepening and buy 2 ZT contracts while selling 1 ZN contract. If rates move up 1 basis point in a pure parallel shift, the long ZT leg loses about 2 × $36 = $72, while the short ZN leg gains about $74 — nearly offsetting, with only a roughly $2 residual left over. Now suppose instead the 2s10s spread widens by 20 basis points (10-year yields rise 20bp more than 2-year yields). Using the matched DV01, the position gains approximately $74 × 20 ≈ $1,480. This is a simplified approximation that ignores convexity, roll, and settlement-date effects, but it illustrates the central mechanic: a parallel move cancels out, and only the spread change flows through to P&L.
Carry, Rolldown, and the Risks You Need to Know
- Carry can work against the direction of your trade. A steepener typically means buying (receiving interest on) the short end and selling (paying interest on) the long end. While the curve remains inverted — short yields still above long yields — the daily carry on that structure accrues negative, quietly eating into the position before the spread actually widens. Commentary through parts of 2025 repeatedly noted negative carry on steepener positions even as the curve un-inverted; that's a description of a specific stretch of market conditions, not a permanent feature of the trade.
- Duration neutrality only cancels a parallel shift — it does nothing to protect you if the spread moves the wrong way. Put on a steepener and get a flattening instead, and you lose money regardless of how well the DV01s were matched.
- Cash Treasuries and futures don't always move in perfect lockstep. Cheapest-to-deliver mechanics and settlement conventions can make the futures-implied 2s10s spread drift slightly from the cash-market spread, so it's worth checking how closely your target spread is actually reflected in the futures before sizing a position.
- Leverage magnifies the outcome in both directions. Treasury futures let you control large notional exposure with relatively little margin, so an unexpected move against you can erase capital quickly — a dynamic that has shown up repeatedly in reporting on macro funds that took large curve-trade losses since 2022.
- Volatility spikes hardest around policy inflection points. As covered in Lesson 69 on trading FOMC and CPI releases, the whole curve can reprice sharply in minutes around major policy announcements, which is a good reason to trim size heading into them.
FAQ
Can retail traders actually put on a curve trade?
Yes, approximately. Without a futures account, you can buy a short-duration Treasury ETF and sell (or use an inverse fund in place of) a longer-duration Treasury ETF to get similar directional exposure to the spread. The trade-off is that matching duration this way is far less precise than futures, and shorting the long leg directly isn't always practical through an ordinary brokerage account.
What's the most common way a steepener loses money?
The most direct way is simply getting the call wrong — the curve flattens instead of steepens. A less obvious way is time itself: if the spread stays roughly flat for an extended period, negative carry on an inverted-curve structure can quietly erode the position even without a big directional move against you.
Is 2s10s or 10s30s more widely watched?
The 2s10s spread (the TUT trade) is the one most often cited as a read on growth expectations and central bank policy. The 10-year/30-year NOB spread tends to be discussed more in terms of long-end issuance, deficit financing, and term-premium shifts than near-term monetary policy.
What exactly does "negative carry" mean here?
It's the P&L you accrue just from holding the position day after day, separate from any spread movement. In a structure where you're long the short-dated leg (receiving its yield) and short the long-dated leg (paying its yield), if the short end's yield is still higher than the long end's — an inverted curve — you're paying out more in interest on the leg you're short than you're receiving on the leg you're long, and that gap quietly compounds against you each day.
Summary
- A curve trade isn't a bet on the direction of rates — it's a bet on whether the spread between short- and long-term yields widens (a steepener) or narrows (a flattener), and the four underlying regimes (bull/bear steepener, bull/bear flattener) explain why the same spread move can have very different causes.
- The curve's shape comes from a tug-of-war between central bank policy expectations (mostly the short end) and the term premium driven by issuance, deficits, and inflation risk (mostly the long end) — and when those forces disagree, even the direction of the move gets argued over.
- Sizing the two legs by DV01 cancels out a parallel shift in rates, leaving only the spread change as P&L; in the worked example, roughly 2 ZT contracts per 1 ZN contract gets you close to duration-neutral.
- Professional traders tend to use precise Treasury futures spreads like TUT, NOB, and FIT, while retail traders more often reach for a less-precise but far more accessible Treasury ETF pair trade.
- Duration neutrality removes parallel-rate-move risk, but the spread still has to move your way — and negative carry while inverted, cash/futures basis risk, and leverage-amplified losses are all risks that remain squarely on the table.