Trading Strategies · Lesson 96/96 · 13 min read
NYSE TICK Index Trading: Fading Extremes and Filtering Trend Days for Intraday Scalps
In this article
- The Small Panel Every Index Futures Scalper Keeps Open
- Why Would Thousands of Stocks Tick the Same Way at Once?
- Reading the Levels: Conventional, Not Validated, Thresholds
- TICK vs. the McClellan Oscillator: Same Raw Material, Totally Different Job
- Trading Rules: Fading Extremes and Filtering Trend Days
- TICK Divergence: Reading the Pattern, Not Just the Number
- A Worked Example: 10 Minutes of TICK Readings
- FAQ
- Limitations and Caveats
- Summary
The Small Panel Every Index Futures Scalper Keeps Open
Watch over the shoulder of someone scalping ES (E-mini S&P 500) or Nasdaq futures, and next to the price chart there's almost always a second, smaller window running — the NYSE TICK Index ($TICK). Lesson 35's Market Breadth (A-D Line and McClellan Oscillator) measured market-wide participation on a day-by-day basis. TICK asks the same underlying question — how broadly is the market actually moving? — but on a timescale of seconds rather than days, built to catch the short, repeated surges and reversals that happen dozens of times within a single session.
TICK is simply the number of NYSE-listed stocks whose most recent trade printed higher than the one before it (an uptick), minus the number that printed lower (a downtick); unchanged trades aren't counted. Because the figure is recalculated on essentially every trade throughout the day, it isn't telling you "how many stocks finished up today" the way the A-D Line does — it's telling you, right now, in which direction thousands of stocks are simultaneously hitting their quotes. A Nasdaq-listed equivalent, $TICKQ, exists too, but the NYSE version remains the one traders reference most.
What makes TICK different from most other overlays is that it counts stocks, not dollars. A single name trading enormous volume barely moves it. But if hundreds or thousands of names each print even a small uptick at the same moment, TICK swings hard. It's best understood as a measure of simultaneity across the market, not a measure of size.
Why Would Thousands of Stocks Tick the Same Way at Once?
Any one stock ticking up is unremarkable. Hundreds or thousands of NYSE names ticking the same direction within the same few seconds is a different story — that kind of coordination is hard to explain as coincidence. The usual culprit is money flowing at the index level rather than the stock level: index arbitrage between S&P 500 futures and the underlying basket, large program trades, and ETF-related basket orders all buy or sell hundreds of constituent names in a single sweep. When that basket order hits, it fires the best offer (or bid) on many names essentially simultaneously, and TICK spikes. An extreme TICK reading is less a statement about any individual company and more a signal that index-level flow is leaning hard in one direction right now.
This mechanical origin is exactly what makes fading TICK extremes a coherent idea in the first place. A burst of coordinated buying or selling driven by arbitrage and basket flow tends to be a short, self-limiting event rather than a durable shift in supply and demand — there's only so much basket flow available to keep pushing thousands of names the same way at once. Once that flow is spent, price has a tendency to snap back, at least briefly, in the other direction.
ETF creation/redemption mechanics make this concrete. A large index ETF like SPY is designed to track the value of its underlying basket closely; whenever a gap opens between the ETF's price and the basket's fair value, arbitrage algorithms step in to buy or sell the whole basket at once to close it. That single basket order hits hundreds of best quotes almost simultaneously, pushing TICK sharply in one direction — a purely mechanical print that has nothing to do with any one company's fundamentals, and one that tends to unwind relatively quickly once the imbalance is closed.
Reading the Levels: Conventional, Not Validated, Thresholds
The ranges below are the conventions futures day traders have passed down for decades — not a standard set or validated by any exchange or peer-reviewed study. The same number can mean something different depending on the market's overall volatility regime, so treat these as a rough starting point, not a fixed rule.
| Range | Common Reading |
|---|---|
| Within ±400 | "Noise" zone — rarely used for directional decisions |
| ±600 to ±800 | A short-term lean building — worth watching, not yet extreme |
| Around ±1,000 | The traditional "extreme" threshold — where counter-flow often starts to appear |
| Beyond ±1,500 | A rare, very extreme reading — usually tied to major news, earnings, or an FOMC release |
In practice, many traders judge these numbers relative to that session's own typical range rather than as fixed triggers. If TICK has mostly stayed within ±500 all morning, a reading of ±800 is already an unusually large move for the day. On a day with an outsized catalyst like a CPI release, a reading of ±1,000 might be entirely ordinary.
Why the Threshold Drifts Over Time
The ±1,000 convention took hold back when thousands of NYSE names traded actively every day. The number of listed names, overall participation, and average per-name liquidity have all shifted meaningfully over the decades since, and continue to shift. If the listed count shrinks or volume concentrates more heavily in a handful of mega-caps, the same ±1,000 print becomes easier or harder to reach than it used to be. Some traders prefer not to anchor to a fixed historical number at all, and instead look at the highs and lows TICK has actually touched over the past several sessions to set a threshold that fits the market as it is right now.
TICK vs. the McClellan Oscillator: Same Raw Material, Totally Different Job
TICK and the McClellan Oscillator both start from the same basic count — advancing names minus declining names — but differ completely in how often they update and what they're used for. Confusing the two means applying a signal on the wrong timeframe entirely.
| NYSE TICK | McClellan Oscillator | |
|---|---|---|
| Update frequency | Real time, recalculated on essentially every trade | Once per trading day, at the close |
| Underlying data | Upticks vs. downticks on the most recent trade | 19-day vs. 39-day EMA spread of daily net advances |
| Typical user | ES/NQ futures scalpers, intraday day traders | Swing/position traders, market-regime analysts |
| Main use case | Fading a lean that resolves within minutes; filtering trend days | Confirming the breadth and health of a rally over weeks to months |
| What an extreme means | Program/basket flow is momentarily exhausted | Fewer stocks are participating in the medium-term advance |
The McClellan Oscillator answers "is this month's rally broad-based?" TICK answers "is the market overbought or oversold right now, in this exact moment?" They operate on entirely different clocks, even though they're built from the same raw ingredient.
Trading Rules: Fading Extremes and Filtering Trend Days
TICK is applied in practice two different ways.
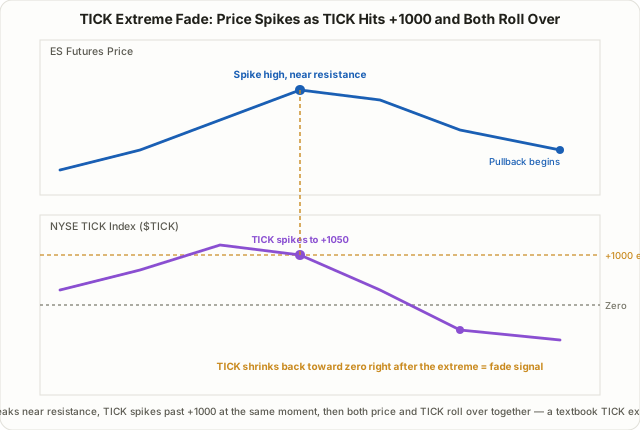
1. Fading extremes (assumes a range-bound session). Wait for TICK to reach the traditional extreme zone near ±1,000, and then wait further for it to start rolling back toward zero — adding confirmation from price structure (a prior support/resistance level, a short-term reversal candle) before taking a small position in the opposite direction. The key is waiting for the moment TICK turns, not the moment it first touches the extreme. Entering directly at the extreme itself gets you repeatedly run over on days when the move simply keeps going.
2. Filtering trend days. If a short moving average of TICK (a 1- to 5-minute simple average, for instance) stays pinned on one side of zero for most of the session, that's usually a trend day, where following the move beats fading it. On days like that, TICK can print +800 or +1,000 repeatedly without ever reverting, and treating each print as a fade signal produces a string of stopped-out trades.
Waiting for the reversal rather than entering at the touch matters because the same extreme reading doesn't behave the same way every day. A +1,000 print sometimes rolls straight over into a reversal, and sometimes just keeps re-extending into a trend. There's no reliable way to tell the two apart in advance — the practical approach is to watch what happens after the extreme (does it shrink quickly back toward zero, or does it keep hovering near the same level) and let that behavior make the call for you. For that reason, TICK fades are rarely entered the instant the extreme prints; most traders wait for one additional confirming signal — a retest of a prior level, a reversal candle with a long wick, or fading volume.
Risk management. TICK-based scalps are typically held for minutes at most and often traded through leveraged futures or options, so the same discipline from Lesson 6's Risk/Reward and Money Management applies directly. A sensible stop sits just beyond the prior extreme being re-tested, or is sized off the session's own ATR as described in Lesson 13's ATR-Based Risk Filters. Never size up a position because one extreme reading looks compelling — the per-trade risk cap should stay fixed regardless of how strong any single signal appears.
The first 30 minutes after the open deserve extra caution. Overnight order flow gets unwound all at once right after the bell, and TICK tends to swing wider and more erratically than later in the session. It's genuinely hard to tell, in that window, whether an extreme reading reflects flow being exhausted or a brand-new trend just getting started. Many TICK scalpers treat the first 15–30 minutes conservatively, or simply watch the early range form before trading fades or trend continuations off it.
TICK Divergence: Reading the Pattern, Not Just the Number
A more refined read than watching a single extreme is comparing TICK's swing highs and lows against price's own swing highs and lows — the same logic as the breadth divergence covered in Lesson 35, compressed down to a timeframe of minutes rather than days.
Suppose ES rallies in three successive waves during the morning session, each one printing a new high. If the first wave pushes TICK to +1,100, the second wave makes a new price high but TICK only reaches +850, and the third wave makes yet another price high while TICK manages only +600, that's a TICK divergence — price keeps climbing, but the breadth and speed of participation behind each wave is shrinking. It's read as an early warning that the rally is weakening under the surface, even while price itself still looks strong.
The same caveat from Lesson 35 applies here too: divergence is a warning sign, not a confirmed reversal. Plenty of rallies add one more wave and keep climbing without the divergence ever resolving. Treat TICK divergence as supporting evidence that strengthens an extreme-fade setup, not as a standalone trade trigger on its own.
A Worked Example: 10 Minutes of TICK Readings
Here's a simplified minute-by-minute snapshot during an ES futures session.
| Time | TICK | ES Price Action |
|---|---|---|
| 09:31 | +320 | Gentle rally |
| 09:32 | +680 | Rally accelerates |
| 09:33 | +1,050 | Sharp spike, near resistance |
| 09:34 | +740 | Advance stalling |
| 09:35 | +210 | Rally stalls, small pullback begins |
| 09:36 | -180 | Pullback continues |
At 09:33, TICK crossed the traditional extreme threshold at +1,050, and from the very next minute it began shrinking quickly (+1,050 → +740 → +210). If price also happened to be sitting near a prior resistance level at that moment, the 09:34–09:35 window builds a reasonable case for a brief short scalp.
The Same Extreme, a Different Outcome: a Trend-Day Failure Case
Now compare that with a session carrying a genuine catalyst — say, right after a CPI release.
| Time | TICK | ES Price Action |
|---|---|---|
| 08:31 | +950 | Sharp rally right after the CPI print |
| 08:32 | +1,120 | Rally continues, no pullback |
| 08:33 | +1,080 | Slight slowdown, still at an extreme |
| 08:34 | +1,200 | Re-extends to a new high |
| 08:35 | +1,150 | Still far from the zero line |
Here, TICK stays pinned above +900 for the entire window and never drifts back toward zero — the opposite of the "spike then shrink" pattern from the first example. This is the "keeps re-extending at the extreme" pattern instead. Fading this purely off the extreme reading would have meant getting run over as price kept grinding the same direction. On a day like this, whether TICK actually returns toward zero matters far more than the absolute reading itself.
FAQ
How is TICK different from the A-D Line?
Both start from "advancing stocks minus declining stocks," but the A-D Line accumulates that count once per trading day, while TICK recalculates on essentially every trade throughout the session. The A-D Line is built to track the breadth of a rally over weeks or months; TICK is built to catch intraday swings that resolve in minutes or hours. Comparing the two on the same timeframe is a category error.
Can something like TICK be used on the Korean market (KOSPI)?
Not directly — NYSE $TICK itself depends on real-time U.S. exchange trade data and can't simply be imported onto KRX data. That said, the underlying math (counting currently-upticking names minus downticking names) isn't exchange-specific, so a platform with real-time KOSPI 200 trade data could in principle construct a similar measure. The specific thresholds like ±1,000 are calibrated to the number of NYSE-listed names and U.S. market structure, though, and would need separate validation rather than being applied as-is.
Should I trade off TICK alone?
No. TICK only tells you whether the broad market is leaning one way at this moment — it says nothing about which stock to trade or at what price. It's more reliable when paired with a finer-grained read of order flow, like Lesson 16's Footprint Charts and CVD, or with price structure such as a prior support or resistance level.
Where can I actually watch TICK?
Most platforms that provide real-time U.S. futures and equity data — thinkorswim, NinjaTrader, Sierra Chart, or TradingView's $TICK symbol — let you plot it as its own panel. Confirm the feed is genuinely real time rather than delayed, since delayed data defeats the entire point of a tool built around immediacy.
Can TICK be combined with the VWAP bands from Lesson 89?
Yes — they complement each other well. Lesson 89's VWAP Standard Deviation Bands measure how far price has stretched from today's average; TICK measures how lopsided the whole market's participants are right now. If price touches the 2σ VWAP band at the same moment TICK hits an extreme and starts rolling over, two independent data sources — price dispersion and breadth of participation — are pointing at the same overextension, which is a stronger confirmation than either signal alone.
Limitations and Caveats
- These are conventions, not validated backtested thresholds. The ±1,000 extreme marker is an experience-based number passed down among traders, not an officially tested statistical cutoff, and its meaning shifts as overall market volatility changes.
- Only meaningful during regular trading hours. With thin participation in pre-market and after-hours sessions, a handful of trades can distort the reading, and the first few minutes after the open can swing unusually wide too.
- Requires a genuinely real-time data feed. Delayed data removes the one thing that makes TICK useful in the first place: immediacy.
- Doesn't translate directly to single-stock trading. TICK measures market-wide lean, so it's most useful on instruments closely tied to the broad market — index futures and index ETFs — and can diverge sharply from a name trading on its own news.
- Divergence confirms slowly. TICK divergence, described above, needs at least two or three waves to compare before it means anything, which makes it awkward to apply on the fastest scalping timeframes.
- Listed-name composition shifts over time. As noted above, the number and makeup of NYSE-listed names changes over the years, so a threshold that worked a few years ago is worth periodically re-checking against recent data rather than assumed to still apply.
Summary
- The NYSE TICK Index is uptick count minus downtick count across NYSE-listed stocks, recalculated essentially in real time — an "ultra-short-horizon" breadth measure.
- Thousands of stocks ticking the same direction at once usually reflects index-level flow — program trades, basket orders, ETF arbitrage — rather than any individual company's news, and fading extremes relies on that flow being self-limiting.
- ±1,000 is a commonly cited extreme threshold, but it's a convention rather than a validated rule, and should be judged relative to the session's own typical range.
- On trend days, where a short moving average of TICK stays pinned on one side of zero, fading extremes tends to fail repeatedly — filtering for trend days first is essential.
- TICK shares its raw data with the McClellan Oscillator but differs completely in update frequency and purpose, so the two aren't interchangeable.
- It requires real-time data, loses reliability outside regular hours, and should always be combined with price structure and a defined stop rather than traded as a standalone signal.