Trading Strategies · Lesson 95/95 · 10 min read
Volatility Skew and the 25-Delta Risk Reversal: Reading Sentiment From Put vs. Call Pricing
In this article
- Two Equally Out-of-the-Money Options, Two Different Prices
- What Skew Actually Is: The Market Disagreeing With a Textbook Assumption
- The 25-Delta Risk Reversal: Compressing Skew Into One Number
- A Worked Numeric Example
- Why the Shape Exists: Supply, Demand, and Dealer Hedging
- Equity Skew vs. Crypto Skew
- Three Practical Ways Traders Use Skew
- Distinguishing Skew From Other Options Indicators
- Limitations and Caveats
- FAQ
- Summary
Two Equally Out-of-the-Money Options, Two Different Prices
Picture an index at 5,000 with a put struck 5% below spot and a call struck 5% above spot, both expiring in 30 days. They're both out-of-the-money (OTM) by the same distance. Yet if you check real quotes, the put almost always carries a noticeably higher implied volatility (IV) than the call. That price gap is volatility skew, and the single number traders use to summarize it is the 25-delta risk reversal (RR25). This lesson covers why skew exists, how to calculate and read RR25, and how it answers a different question than the options indicators already covered in this course — Lesson 15 on gamma exposure (GEX) and Lesson 60 on the put-call ratio.
What Skew Actually Is: The Market Disagreeing With a Textbook Assumption
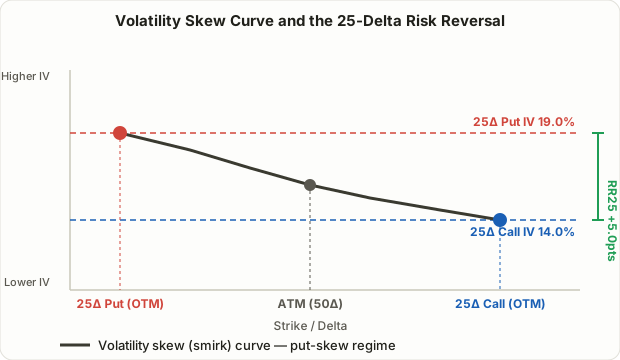
The Black-Scholes model assumes a single volatility applies to every strike of the same underlying and expiry. If that were true, plotting IV against strike would produce a flat line. In practice it doesn't. For most equity index options, OTM puts trade at meaningfully higher IV than at-the-money (ATM) options, while OTM calls trade at lower IV. That downward-sloping, one-sided curve is called skew, or sometimes a smirk — distinct from a symmetric smile, where both wings trade above ATM.
The commonly cited turning point for this structure is Black Monday in October 1987. Before that crash, index option pricing looked closer to a flat smile. A one-day drop of more than 20% left a lasting appetite for downside "tail risk" insurance, and that structural demand for protective puts is widely credited with cementing the permanent put-skew shape still seen in equity index options today. Treat this as a well-known industry narrative rather than a rigorously proven statistical fact.
The 25-Delta Risk Reversal: Compressing Skew Into One Number
Rather than reading the whole curve every time, traders typically pull one comparison point: the IV gap between a put and a call at similar delta. The standard reference point is 25 delta — an OTM call with a delta near +0.25 and an OTM put with a delta near -0.25 (absolute value 0.25). Delta is used instead of a fixed price distance because it reflects what the market thinks the odds of finishing in-the-money actually are, which is more consistent across different volatility regimes than a flat percentage move.
RR25 = IV of the 25-delta put − IV of the 25-delta call
- RR25 positive means the put is pricier — a put skew, signaling stronger demand for downside protection or a relatively bearish tilt. Most developed-market index options sit in this state most of the time.
- RR25 negative means the call is pricier — a call skew, signaling speculative upside demand or bullish positioning.
Important caveat: data providers don't agree on the sign. Some venues and data services, including Deribit, quote RR25 exactly as defined above (put IV minus call IV). Others define it the opposite way (call IV minus put IV), which flips the sign for the same underlying market condition. Before comparing numbers across sources, always confirm which side gets subtracted from which. This lesson uses the put-minus-call convention consistently throughout.
A Worked Numeric Example
The numbers below are illustrative only, not a real quote from any specific date. Assume an index at 5,000 with 30 days to expiry.
| Option | Implied Volatility |
|---|---|
| At-the-money (ATM, 50 delta) | 16.0% |
| 25-delta OTM put | 19.0% |
| 25-delta OTM call | 14.0% |
RR25 = 19.0% − 14.0% = +5.0 vol points (put skew)
Relative to the 16% ATM baseline, the put trades 3 points richer and the call trades 2 points cheaper. That tells you the market is willing to pay more for downside insurance than for upside speculation right now. If RR25 jumped from +5.0 to +8.0 the next day with no change in spot price, that's a signal that hedging demand got noticeably more urgent overnight. A sharp drop toward zero or into negative territory, by contrast, often marks fear draining out and speculative call buying taking over.
Why the Shape Exists: Supply, Demand, and Dealer Hedging
Skew is ultimately a supply-and-demand story that plays out differently on each side of the chain.
- Structural put demand. Pension funds, institutional asset managers, and plenty of retail investors buy puts mainly as insurance against a crash, not as a directional bet expecting to profit. That steady, price-insensitive buying keeps pushing put IV higher over time.
- Structural call supply. On the other side, a large share of market participants run covered-call-style strategies, selling calls against stock they already hold to collect premium. That steady selling pressure keeps call IV relatively depressed.
- Dealer hedging reinforces the shape. Market makers absorbing this flow end up net short OTM puts and net long OTM calls in aggregate, and have to delta-hedge accordingly. That's the same positioning assumption underlying vanna exposure, covered in Lesson 59 — skew is essentially a snapshot of that positioning frozen in price at one moment, while vanna and charm describe how that same positioning moves as volatility and time pass. The two are complementary lenses on the same dealer book.
Equity Skew vs. Crypto Skew
Skew doesn't always lean the same direction. Which way it leans — and how stable that lean is — differs noticeably by asset class.
| Traditional Equity Index Options (e.g., S&P 500) | Bitcoin and Ethereum Options | |
|---|---|---|
| Default skew direction | Put skew (RR25 positive) has been structurally entrenched for decades | Put skew is common, but flips to call skew occur noticeably more often |
| Why the default direction took hold | Structural demand for crash insurance after Black Monday 1987 | Recurring waves of leveraged, trend-chasing call buying during strong rallies |
| When it flips to call skew | Rare, and usually short-lived when it happens | Data providers have repeatedly reported periods where call IV exceeds put IV during strong uptrends and new-high expectations |
| Common data sources | CBOE SKEW Index, brokerage and data-vendor platforms | Deribit's DVOL and skew charts, specialist crypto derivatives data providers like Amberdata |
The figures and tendencies here summarize patterns commonly reported across multiple options data services and research notes, not a fixed value pinned to a specific date. The key takeaway is that crypto options markets are structurally more prone to the sign of skew flipping than traditional equity index options are, so always weigh a current reading against that asset's own recent baseline rather than a textbook assumption.
Three Practical Ways Traders Use Skew
1. As a sentiment and positioning gauge. When RR25 pushes well above its recent average band for that underlying, downside hedging demand has gotten unusually urgent. Where PCR (Lesson 60) measures sentiment through trading volume, skew measures it through price (IV) — two different lenses on the same crowd behavior. When both point the same direction at the same time, that combination is generally treated as a stronger signal than either alone.
2. By comparing the skew term structure across expiries. Lining up RR25 for near-dated, one-month, and three-month expiries reveals whether the market is more worried about near-term or longer-horizon downside risk. A spike confined to short-dated expiries usually points to hedging ahead of a specific known event (earnings, a Fed meeting); a broad-based rise across every tenor tends to reflect a more structural worry.
3. As a trade in its own right. Professional options desks sometimes express a view that skew is too steep (or too flat) by constructing the risk reversal itself — selling the richer option and buying the cheaper one. If put skew looks excessive, that might mean selling the expensive 25-delta put and buying the comparatively cheap 25-delta call, betting on skew normalizing. Even though this structure can look close to zero-cost upfront, it carries simultaneous delta, gamma, and vega exposure that all move as the market does — a meaningfully more complex risk profile than a simple directional bet. For most traders, learning to read RR25 alongside other indicators is a better starting point than building this position directly.
Distinguishing Skew From Other Options Indicators
GEX (Lesson 15), max pain (Lesson 57), PCR (Lesson 60), and volatility skew all start from the same options-chain data but answer different questions.
| Indicator | Question it answers |
|---|---|
| Volatility skew / RR25 | Which side — put or call, at similar distance — is priced richer? (price/IV-based sentiment) |
| Put-call ratio (PCR) | Which side traded more volume? (flow-based sentiment) |
| Gamma exposure (GEX) | How much does the dealer book need to buy or sell as price moves? (hedging mechanics) |
| Max pain | Which strike is least favorable to option buyers at expiration? (settlement economics) |
Treat all four as complements rather than substitutes. Because PCR and skew both proxy for sentiment but from different inputs (flow vs. price), agreement between the two is generally considered more meaningful than either reaching an extreme on its own.
Limitations and Caveats
- The sign convention isn't standardized. As noted above, some data providers flip the direction of the subtraction. This is the first thing to check before comparing numbers across sources.
- Raw data access is limited. Computing RR25 yourself requires a full options chain and volatility-surface data, which usually sits behind a paid data feed. Free, pre-packaged alternatives for retail access are narrower — the CBOE SKEW Index and Deribit's public skew charts are among the more accessible options.
- Extremes don't call exact turning points. Like PCR, an extreme skew reading doesn't guarantee an imminent reversal. During strong downtrends, put skew has often been seen to stay extreme — and get more extreme — for days or weeks before anything turns.
- The baseline shifts with the market regime. RR25's typical band tends to compress during long, low-volatility bull markets and widen during panics. Applying an average from several years ago to today's market risks a serious misread.
- Deep OTM strikes get noisy. Options further out than 25 delta (10 delta, for example) trade with wider spreads and thinner volume, which adds significant noise to the same calculation.
FAQ
Are volatility skew and volatility smile the same thing?
Not exactly. A curve where only one wing — puts or calls — trades persistently above ATM is called skew (or a smirk); a curve where both wings trade above ATM, forming a U-shape, is called a smile. In practice the two terms get used loosely, so it's worth checking which shape a given source actually means.
If RR25 flips from positive to negative, does that confirm a trend change?
Not on its own. A sign flip in RR25 reflects a shift in options-market positioning and sentiment, not confirmed proof that the underlying price trend has reversed. Cross-check it against price action, volume, and other sentiment indicators like PCR before drawing a conclusion.
Can retail traders actually see 25-delta risk reversal data?
Computing it yourself from a full chain requires a paid volatility-surface feed, but pre-packaged, publicly accessible versions exist — the CBOE SKEW Index for equities and Deribit's public Bitcoin and Ethereum skew charts for crypto. Just remember that calculation methods and sign conventions can differ between sources.
Summary
- Volatility skew describes how implied volatility differs across strikes (or deltas) at the same expiry; for most equity index options, OTM puts structurally trade richer than OTM calls.
- The 25-delta risk reversal (RR25 = 25-delta put IV minus 25-delta call IV) compresses that asymmetry into one number — positive means put skew (downside-hedging demand dominates), negative means call skew (upside speculation dominates) — but sign conventions vary across data providers, so always verify which one you're reading.
- Put skew stems from a structural mismatch between steady put-buying insurance demand and steady call-selling premium supply, reinforced by dealer hedging flow; crypto options markets flip between put skew and call skew more often than traditional equity indices do.
- In practice, skew works best as an IV-based sentiment check alongside PCR, GEX, and max pain, and comparing it across expiries (the term structure) helps separate near-term event risk from broader structural worry.
- Extreme readings don't pinpoint exact turning points, and the normal baseline itself shifts with the market regime — so treat this as a supporting indicator to combine with other confirmation, never a standalone signal.