Trading Strategies · Lesson 68/69 · 10 min read
Point and Figure (P&F) Chart Trading: Box Size, Three-Box Reversal, and Price Targets
In this article
- What Point and Figure Actually Plots
- The Two Settings That Define Everything: Box Size and Reversal Amount
- How Columns Actually Form: A Worked Example
- Trading Signals: Double Top Breakouts and Double Bottom Breakdowns
- Setting Price Targets: Vertical and Horizontal Counts
- Point and Figure vs. Renko: Two Cousins, Different Rules
- Putting the Rules Together
- Limitations to Keep in Mind
- FAQ
- Summary
What Point and Figure Actually Plots
Earlier in this course, Renko charts introduced the idea of building a chart from price movement instead of time. Point and Figure (P&F) is arguably the original version of that idea. It dates back to the late 1800s, around Charles Dow's era, making it one of the oldest surviving techniques in technical analysis. There's no time axis, no volume, and no open/close distinction the way a candlestick has. A P&F chart tracks exactly one thing: has price moved far enough in a given direction to matter.
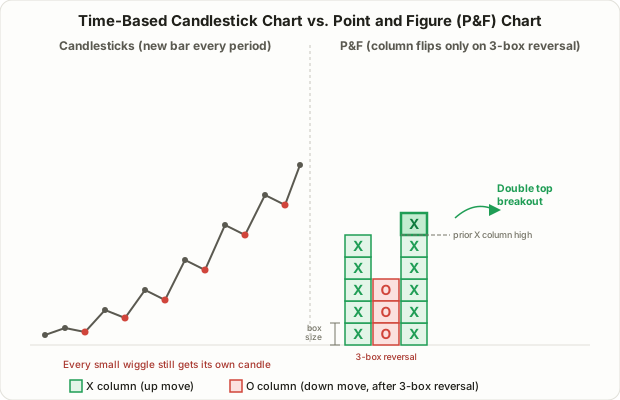
The mechanics are almost childishly simple. When price rises, you stack an X. When it falls, you stack an O. As long as the move keeps going in one direction, new marks pile onto the same column. Once direction actually flips, the chart starts a brand-new column next to it. If a stock spends two weeks grinding sideways without committing to a direction, the P&F chart records absolutely nothing new during that stretch — a candlestick chart would still print a new bar every single day regardless. P&F only reacts to what it considers a real directional move. It's a genuinely old-school method, but it has resurfaced in recent years through platforms like StockCharts and TradingView, and even in crypto-exchange education content that frames it as a clean way to strip noise out of Bitcoin's price action and focus purely on direction.
The Two Settings That Define Everything: Box Size and Reversal Amount
Once you understand two numbers, you understand the whole system.
Box size: the price increment one X or O represents. Set the box to $1,000, and price has to move a full $1,000 before a new mark gets added. Traders commonly fix box size as a percentage of the stock's price (roughly 1–3%), or scale it dynamically using ATR, covered in Lesson 13. Either way, this is a widely used convention — not a formula guaranteed to fit every symbol.
Reversal amount: how many boxes price must move against the current column before a new column starts in the opposite direction. The overwhelmingly standard default is a three-box reversal. With a $1,000 box size, that means a rising column doesn't flip to a falling column until price reverses by at least $3,000 (box size × 3). There's no rigorous statistical basis for "three" specifically — it's simply the convention that stuck across decades of practice. Drop the reversal amount to one box and the chart flips columns constantly, hypersensitive to every wiggle; push it up to five or more and it only reacts to genuinely large trend changes.
How Columns Actually Form: A Worked Example
Assume a $1,000 box size and a three-box reversal (so $3,000 is required to flip direction), starting from a price of $50,000.
- Price rises to $51,000 → one box is filled, so one X prints, column top at $51,000
- Price continues to $52,000, then $53,000 → an X prints for each box, column top now $53,000
- Price pulls back to $52,500 → only a $500 retracement, well short of the $3,000 reversal threshold, so nothing changes on the chart
- Price falls further to $49,900 → that's a $3,100 drop from the column top of $53,000, clearing the reversal threshold → a new column starts, filled with O's stepping down from $53,000 toward $50,000, one box at a time
- Price keeps falling to $48,500 → more O's get added to the same column
Notice what happens at step 3: that $500 pullback leaves zero trace on the chart. A candlestick chart would have printed several bars across that stretch, but P&F only records a directional change once it clears the reversal threshold. That's the same philosophy Renko charts use, and the comparison table below spells out exactly where the two techniques diverge.
Trading Signals: Double Top Breakouts and Double Bottom Breakdowns
The oldest and most basic P&F signal asks one question: has a new column exceeded the high (or low) of the previous column running the same direction?
- Double Top Breakout: a new X column climbs at least one box higher than the high of the prior X column — read as a bullish signal. Continuing the example above, if a new X column forms after the O column ends and climbs past $53,000 (the prior X column's high) to $54,000, that's a double top breakout.
- Double Bottom Breakdown: the mirror image — a new O column falls at least one box below the low of the prior O column, read as a bearish (or short) signal.
- Triple tops and triple bottoms: when price tests the same resistance (or support) twice and fails, then breaks through on the third attempt, that's commonly treated as a stronger signal than a simple double top. It's worth being explicit, though, that this is a descriptive pattern about repeated tests of a level, not a statistically validated edge.
These rules are genuinely old — first documented in the early 1900s — but conceptually they're the exact same logic as Lesson 4's support/resistance breakout: buy when a prior high gets taken out. The only difference is that "prior high" is defined in terms of X columns instead of candles.
Setting Price Targets: Vertical and Horizontal Counts
What actually sets P&F apart from most other chart types is that it comes with its own built-in formula for projecting a price target once a breakout fires. Two methods dominate.
Vertical Count: count how many X's sit in the column that produced the breakout (or O's in the column that made the bottom), then apply:
Price objective = number of X's × box size × reversal amount
If the breakout column contains 8 X's, box size is $1,000, and the reversal amount is 3, the projected move is 8 × $1,000 × 3 = $24,000. Add that to the column's starting low — say $46,000 — and the target comes out to $70,000.
Horizontal Count: instead of one column, this counts the width of a sideways base — how many columns the consolidation spans before the breakout.
Price objective = number of columns in the base × box size × reversal amount
A base that consolidates across 6 columns, using the same box size and reversal amount, projects an upside move of 6 × $1,000 × 3 = $18,000.
Both methods have been the standard reference on services like StockCharts for over a century, but here's the caveat that matters most: these formulas are classical technical-analysis heuristics, not statistically validated probabilities. There's no guarantee price ever reaches the calculated target — treat the number as one directional scenario to size a trade against, not a promise.
Point and Figure vs. Renko: Two Cousins, Different Rules
P&F and Renko both throw out the time axis and build a chart purely from price movement, which makes them close relatives — but the mechanics differ in ways that matter for actual trading.
| Point and Figure | Renko | |
|---|---|---|
| Unit of display | Multiple X's or O's stacked in one column | Each brick stands alone, chained in sequence |
| Reversal rule | Configurable reversal amount (commonly 3 boxes) | Traditional method fixes reversal at 2× brick size |
| Built-in price target formula | Yes — vertical and horizontal counts | No standardized equivalent |
| Origin | Late 1800s, one of the oldest charting methods | Popularized in 20th-century Japan, more recently mainstream |
| Visual shape | Grid of stacked X/O columns | Staircase of connected bricks |
| Volume / precise timing | Not available | Not available |
The most practically important difference is that P&F reversal sensitivity is tunable (1, 2, 3, 5 boxes — trader's choice) and it's one of the few classical techniques that actually answers "how far might this go" with a formula, rather than leaving the target entirely to discretion. Renko is excellent at filtering noise and reading trend direction, but it has no equivalent standardized method for projecting a price target.
Putting the Rules Together
- Set box size and reversal amount first. A common starting point is roughly 1–2% of the stock's price for box size, with a three-box reversal as the default sensitivity.
- Treat double top/bottom breaks as the primary signal. A break above the prior X column's high suggests bullish interest; a break below the prior O column's low suggests bearish interest.
- Use the vertical count to frame a target scenario once a breakout fires. Treat it as a reference for sizing risk-reward, not a guaranteed destination.
- Set stops against a real candlestick chart or ATR — never against the P&F chart itself. Since P&F has no precise time or price granularity, stop placement should follow the same discipline covered in Lesson 6's risk-reward and money management.
- Expect long stretches of silence in range-bound markets. Because column reversals are relatively rare events, a choppy sideways market can make P&F look like nothing is happening at all.
Limitations to Keep in Mind
- Volume and exact timing disappear entirely. There's no way to tell from the chart alone when a given X printed or how much volume traded, which makes P&F a poor fit alongside time- and volume-based tools like Lesson 16's order flow and footprint analysis.
- Box size and reversal amount choices drive the outcome heavily. The same price series can generate wildly different signal frequency and different price targets depending on these two settings, which opens real curve-fitting risk if they're tuned to fit past data.
- The price target formulas are heuristics, not validated probabilities. As stressed above, vertical and horizontal counts are a century-old convention, not a statistically guaranteed number.
- Sharp gaps aren't represented honestly. An intraday gap gets sliced into box-sized increments rather than shown as the single abrupt jump it actually was.
- It's not well suited to fast scalping. Because columns change relatively slowly, P&F tends to be used more on daily-or-higher timeframes for swing and position trading rather than minute-by-minute strategies.
FAQ
How do I choose box size and reversal amount?
There's no single correct setting. A common starting point is roughly 1–2% of the stock's current price for box size, paired with the standard three-box reversal, then adjusted if signals feel too frequent or too rare. Basing box size on ATR is also a widely used approach.
Should I trade directly off the vertical or horizontal count price target?
That's not generally recommended. These counting methods have been used for over a century, but there's no statistical guarantee price actually reaches the calculated level. Treat the count as a directional scenario for framing risk-reward, and set actual stops and profit targets using separate risk-management rules.
What kind of trader does Point and Figure suit best?
It tends to suit swing and position traders who want to filter for major directional shifts rather than watch minute-by-minute price action. Because column changes lag real-time price movement, many traders find it poorly suited to scalping or any style that needs precise, fast entries.
Summary
- Point and Figure charts ignore time completely, stacking an X for up moves and an O for down moves only once price clears a preset box size — making it one of the oldest noise-filtering chart techniques still in use.
- Column reversals commonly require a three-box move against the trend; box size and reversal amount together determine how sensitive the chart is.
- The core trading signals are the double top breakout (a new X column exceeding the prior X column's high) and the double bottom breakdown (a new O column undercutting the prior O column's low).
- P&F's distinguishing feature is its built-in price-target math — vertical and horizontal counts — but these are classical heuristics, not statistically validated figures.
- Like Renko, P&F loses volume and exact timing entirely, so real entries and stops should always be confirmed against an actual candlestick chart.