Trading Strategies · Lesson 92/92 · 10 min read
Three Line Break Charts: Trading Reversals Without Picking a Box Size
In this article
- What a Three Line Break Chart Actually Is
- Two Rules Are All You Need: Continuation and Reversal
- Tuning Sensitivity: The N-Line Break Setting
- Trading Rules: The Reversal Line Itself Is the Signal
- A Worked Example: How the Lines Actually Print
- Three Line Break vs. Renko vs. Point & Figure
- Limitations to Keep in Mind
- FAQ
- Summary
What a Three Line Break Chart Actually Is
Two lessons in this course already covered charts that throw out time entirely and plot price movement instead: Renko and Point & Figure. Both share a weakness worth remembering — each needs you to pre-set a size parameter (brick size for Renko, box size and reversal amount for P&F), and that single choice determines how often signals fire and how they time out. Pick the wrong size and the signal quality degrades without you necessarily noticing.
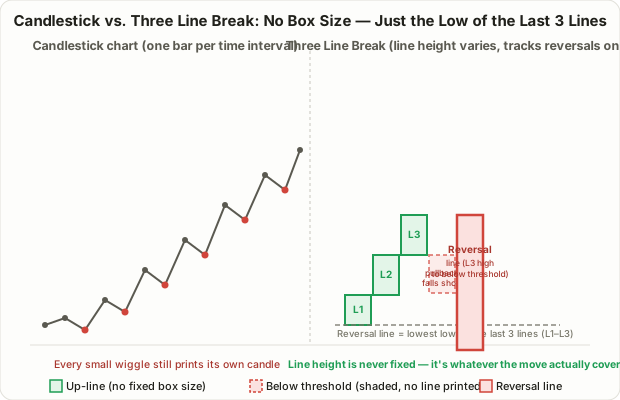
Three Line Break charts solve the same underlying problem — stripping out time-based noise — in a different way: there's no size parameter to choose at all. Each line's height is simply however far price actually moved. Whether a new line even gets drawn, and whether it counts as a reversal, is decided entirely by comparing the latest closing price against the high or low of recent lines — not against some arbitrary box count. As price rises, you stack up-lines; as it falls, you stack down-lines; and only when the trend genuinely turns does a new line print in the opposite color.
The technique originated in Japan and was introduced to American traders by Steve Nison — the technician best known for popularizing Japanese candlestick analysis in the West — in his 1994 book Beyond Candlesticks. It's worth noting that most Korean brokerage trading platforms (HTS/MTS) already ship with a Three Line Break chart type sitting right next to candlesticks and Renko in the menu, yet relatively few retail traders actually use it. Part of the reason is that "reversal is judged against the extremes of recent lines" is a less intuitive mental model than "reversal is judged against a box count." This lesson walks through exactly how that mental model works, with real numbers.
Two Rules Are All You Need: Continuation and Reversal
Understanding a Three Line Break chart comes down to exactly two rules.
The continuation rule is loose. While an uptrend is in force, any close that exceeds the high of the most recent line immediately prints a new up-line — it doesn't matter whether that close clears the old high by a little or a lot. There's no minimum threshold the way Renko requires a full brick-size move. In a downtrend, the mirror version applies: any close below the most recent line's low prints a new down-line.
The reversal rule is strict. To flip direction, the close has to break past the extreme of the last three lines (using the default setting). In an uptrend, that means the close must fall below the lowest low among the three most recent up-lines before a down-reversal line gets drawn. That "three" is where the name comes from. In a downtrend, the mirror applies: the close must rise above the highest high among the three most recent down-lines before an up-reversal prints.
This asymmetry is the whole personality of the chart. Continuing a trend is easy — clear one line's high and you're done. Reversing it is hard — you have to erase the entire extreme of three lines' worth of movement. The practical effect: while a trend is intact, small pullbacks get absorbed without disturbing the chart at all, but once the trend genuinely does turn, the signal arrives a bit later than it would on a time-based chart — though generally with less false-flagging.
Tuning Sensitivity: The N-Line Break Setting
Just like Renko's brick size or P&F's reversal amount, Three Line Break has one sensitivity dial — the number of lines required to confirm a reversal. The default is three (hence the name), but that number isn't fixed.
| Reversal line count | Behavior | Best suited for |
|---|---|---|
| 2-line break | Reversal signals fire faster and more often; catches trend changes earlier but carries more whipsaw risk | Short-term trading, fast-reaction setups |
| 3-line break (default) | The standard, most widely used setting; a balance of speed and reliability | General swing trading |
| 4–10-line break | Signals become noticeably rarer and slower, but the chart barely reacts to mid-trend noise at all | Longer-horizon position trading, macro trend following |
Like most of the conventions covered in this course, this number is a widely cited rule of thumb among traders, not a statistically validated optimum. It's also worth noting that dropping the reversal count to one effectively collapses the chart back into ordinary closing-price ticks — at which point the noise-filtering benefit that makes Three Line Break useful in the first place disappears entirely.
Trading Rules: The Reversal Line Itself Is the Signal
The basic form of a Three Line Break strategy, as commonly described across trading-education material (MQL5, TradingView, and similar sources), comes down to a short list:
- Buy signal: after a run of down-lines, enter when an up-reversal line appears.
- Sell/short signal: after a run of up-lines, enter short — or exit an existing long — when a down-reversal line appears.
- Stay out: when up-lines and down-lines keep alternating with no sustained direction, avoid new entries. That pattern usually means the market is range-bound rather than trending.
- Stops and targets: because the chart itself carries no precise time or volume information, stops should be set against a real candlestick chart or an ATR multiple, following the same principle covered in Lesson 6 on risk-reward and position sizing.
Nison himself recommended against trading off Three Line Break alone, instead pairing it with a regular candlestick chart — using the break chart to filter the broader trend direction while timing precise entries and exits off candlestick patterns or indicators. There's also a real tradeoff in how much extra confirmation to wait for after a reversal line prints: waiting one more close raises your confidence that the reversal is genuine, but it also means more of the new move has already happened by the time you act, which eats into the profit still available.
A Worked Example: How the Lines Actually Print
Say a stock starts at $500 and begins to climb. Here's how the lines print, close by close, using the default 3-line reversal rule.
- Close rises to $510 → Up-line 1 prints (low $500, high $510)
- Close rises to $525 → clears the prior line's high of $510, so Up-line 2 prints (low $510, high $525)
- Close rises to $540 → clears $525, so Up-line 3 prints (low $525, high $540)
- The lowest low among the three most recent lines (1–3) is now $500 — that becomes the reversal threshold.
- Close falls to $515 → still above $500, so nothing changes — the reversal threshold hasn't been breached
- Close falls further to $498 → breaks below $500, so a down-reversal line prints, running from Line 3's high of $540 down to $498
The notable part of this example is the move to $515: that pullback erased roughly 60% of the entire rally from $500 to $540, and yet the chart showed absolutely nothing. Because the reversal threshold is the low of the entire three-line run, the longer and larger that run gets, the deeper a pullback has to go before it counts as a real reversal. That's Three Line Break in miniature — very resistant to mid-trend noise, but correspondingly late to confirm when the trend actually does end.
Three Line Break vs. Renko vs. Point & Figure
All three charts share the same core philosophy — discard time, plot only meaningful price movement — but they define "meaningful" and "reversal" quite differently.
| Three Line Break | Renko | Point & Figure | |
|---|---|---|---|
| Size parameter required | None — line height tracks the actual move | Brick size (required) | Box size (required) |
| Line/brick/box height | Variable, move by move | Fixed (one brick size) | Fixed (one box-size unit) |
| Reversal condition | Breaks the extreme of the last N lines (default 3) | Traditional method fixes it at 2× brick size | Adjustable reversal amount (commonly 3 boxes) |
| Curve-fitting risk | Lower — there's no size to pick in the first place | Tied to the brick-size choice | Tied to the box-size and reversal-amount choice |
| Price-target formula | None standardized | None standardized | Vertical and horizontal count formulas exist |
| Origin | Japan; brought to the US by Nison in 1994 | Japan; popularized more recently | Used since the late 19th century |
The most practically important difference is whether you need to choose a size parameter at all. Both Renko and P&F put that decision in the trader's hands, and getting it wrong distorts the signal. Three Line Break removes that decision entirely, which makes it comparatively resistant to curve-fitting — but the tradeoff is that reversal confirmation gets slower the longer a trend runs, and the whole "break the last N lines" framing takes a bit more effort to internalize than a fixed box count does. Neither approach is strictly better: Three Line Break suits traders who want signal frequency to self-adjust with the size of the actual price swings, while Renko and P&F suit traders who'd rather set that frequency themselves.
Limitations to Keep in Mind
- Volume and precise timing are lost, just as with Renko and P&F. There's no way to tell from the chart alone when a line completed or on what volume, which makes it a poor complement to time- and volume-based tools like Lesson 16's order flow and footprint reading.
- Reversal signals get later the longer a trend runs. Because the threshold is the extreme of the entire three-line run, a long, strong trend requires a correspondingly deep pullback before the chart will admit it's over — a strength against noise and a weakness against timeliness at once.
- Gaps aren't represented honestly. Since only the closing price matters, an overnight gap doesn't appear as a single sharp jump the way it would on a candlestick chart.
- Choppy, range-bound markets produce alternating, low-conviction signals. When up-lines and down-lines keep flipping back and forth with no sustained direction, it's generally safer to treat that as a cue to stay out rather than to trade every flip.
- It isn't recommended as a standalone tool. Nison's own guidance was to pair it with a real candlestick chart — precise entries, stops, and targets still need to come from there.
FAQ
Is Three Line Break better than Renko?
Not categorically. Three Line Break removes the need to choose a size parameter, which lowers curve-fitting risk, but it pays for that with slower reversal confirmation on long trends. Renko lets you tune signal frequency directly by adjusting brick size. The more accurate framing is that both solve the same noise problem through different mechanisms, each with its own tradeoff.
Do I have to use the default 3-line reversal rule?
No. Three is simply the most widely used default, not a fixed requirement. Traders who want faster signals commonly use a 2-line break; those who want fewer, more conservative signals use four or more. Changing the count changes both the frequency and character of the signals, so it's worth backtesting any variant before trading it live.
Where can I find Three Line Break charts?
Most major Korean brokerage HTS and mobile trading apps include it as a built-in chart type alongside candlesticks and Renko. Internationally, platforms like TradingView also offer it, typically listed under its English name, Three Line Break.
Summary
- Three Line Break belongs to the same "ignore time" family as Renko and Point & Figure, but unlike either, it requires no brick-size or box-size parameter — line height simply tracks the actual price move.
- The continuation rule is loose (clear the prior line's high or low and a new line prints); the reversal rule is strict (the close must break the extreme of the last three lines). That asymmetry is the core mechanic.
- The number of lines required to confirm a reversal defaults to three but can be tuned between roughly two and ten — fewer lines for faster, more frequent signals, more lines for slower, more conservative ones.
- The trading signal is simply the appearance of a reversal line itself; alternating up- and down-lines with no sustained direction are generally a cue to stay out.
- Volume and precise timing are unavailable, and reversal signals lag further behind on longer trends, so — as Nison himself advised — pair it with a real candlestick chart and set entries and stops separately.